


Kenanga Research & Investment
Daily Technical Highlights – (MYEG, HOHUP)

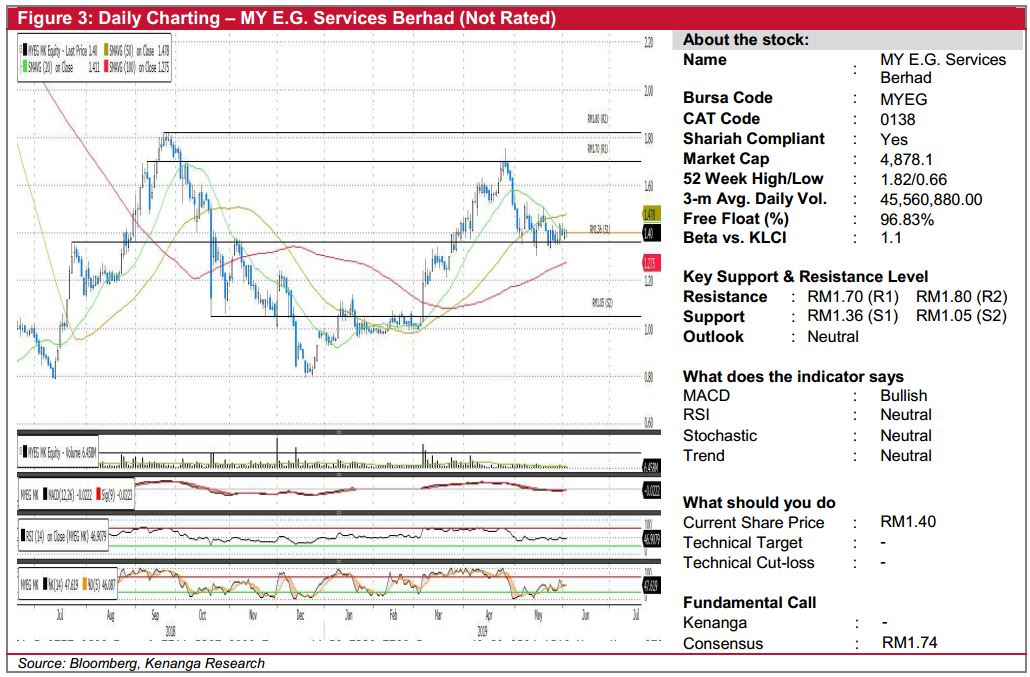
MYEG (Not Rated)
- MYEG closed flat at RM1.40 on Tuesday.
- The stock appears to be consolidating above its 100-day SMA, while RSI remains flat in the neutral zone.
- We observed a similar pattern in Jan-Feb 2019, where the stock consolidated close to its 20 and 50-day SMAs, with similar RSI signals before a rally to a high of RM1.75. Therefore, we believe current consolidation could lead to a potential rally.
- Immediate support levels can be found at RM1.36 (S1) and RM1.05 (S2), while resistance levels can be identified at RM1.70 (R1) and RM1.80 (R2).
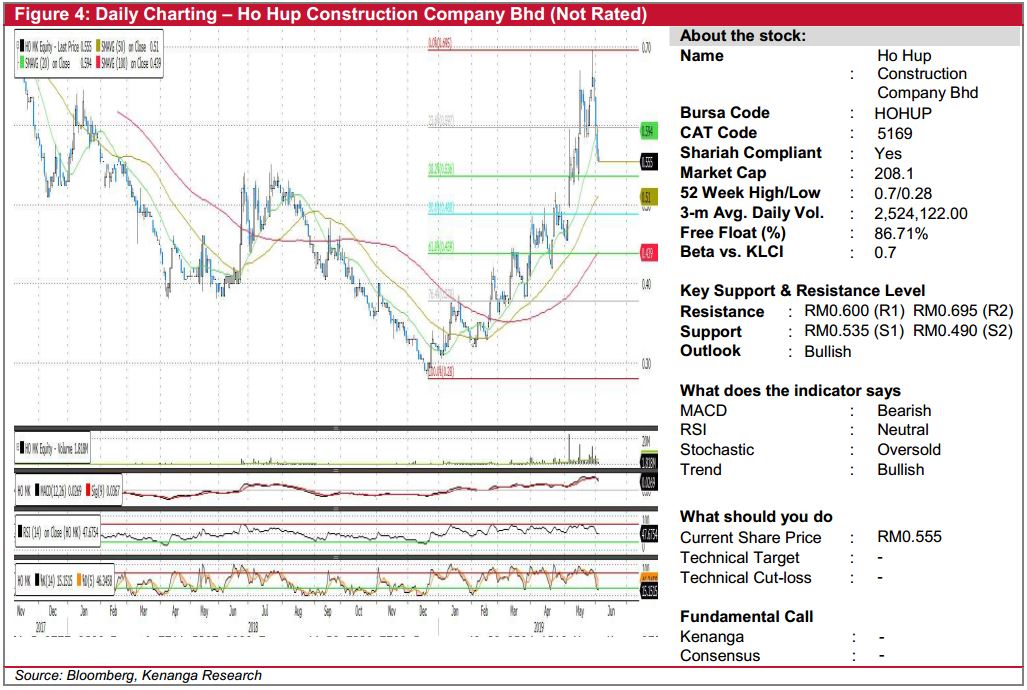
HOHUP (Not Rated)
- HOHUP declined 1.0sen (+1.77%) to end at RM0.555, on Tuesday.
- The stock has been on an uptrend since Jan-19 and has since retraced. Chart-wise, the underlying uptrend remains intact as shorter-term SMAs are trading above longer-term SMAs.
- As the stock has retraced to more palatable levels and RSI as well as stochastic have come off from overbought levels, we believe that there could be a continuation rally.
- Fibonacci suggests key support levels at RM0.535 (S1) and RM0.490 (S2) which we opine could serve as attractive entry points.
- Conversely resistance levels can be found at RM0.600 (R1) and RM0.695 (R2).
Source: Kenanga Research - 7 Jun 2019
Related Stocks
| Chart | Stock Name | Last | Change | Volume |
|---|
More articles on Kenanga Research & Investment
Discussions
Be the first to like this. Showing 1 of 1 comments
Post a Comment
Featured Posts


Latest Videos


Apps


Top Articles
2
save malaysia!
3
4
5
6
7
Koon Yew Yin's Blog
8
Good Articles to Share
Le Pen makes new threat to withdraw support for French government
#
Stock
Score
Daily Stocks
Stock Name
Last
Change
Volume
Stock Name
Last
Change
Volume
Featured Advertisers / Partners


Ride The Bull Short The Bear
CS Tan
4.9 / 5.0
This book is the result of the author's many years of experience and observation throughout his 26 years in the stockbroking industry. It was written for general public to learn to invest based on facts and not on fantasies or hearsay....
RainT
if the chart of MYEG is true then is good
need change my method.....learn to see technical
not just fundamental only
if only fundamental only, it does not work
2019-06-07 12:40