Kenanga Research & Investment
Daily Technical Highlights – (TNLOGIS, FOCUS)
kiasutrader
Publish date: Tue, 23 Jul 2019, 09:07 AM

TNLOGIS (Not Rated)
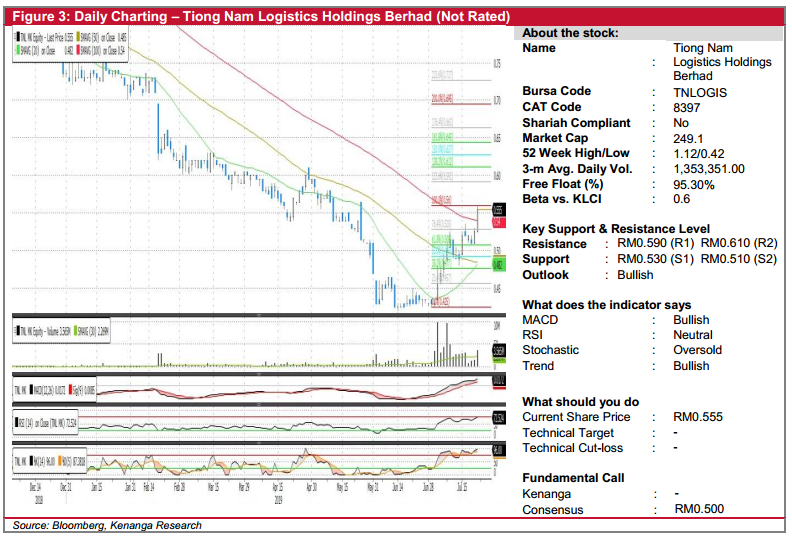
- Yesterday, TNLOGIS gained 3.0 sen (+5.71%) to close at RM0.555.
- The stock formed a long bullish candlestick, punching above its 100-day SMA, which signals a breakout. Its 20 and 50-day SMA could be in the midst of a “Golden-Cross” formation as well.
- Coupled with encouraging upticks from key momentum indicators, we think that the share could trend higher.
- Fibonacci suggests resistances at RM0.590 (R1) and RM0.610 (R2). Conversely, downside supports can be seen at RM0.530 (S1) and RM0.510 (S2).

FOCUS (Not Rated)
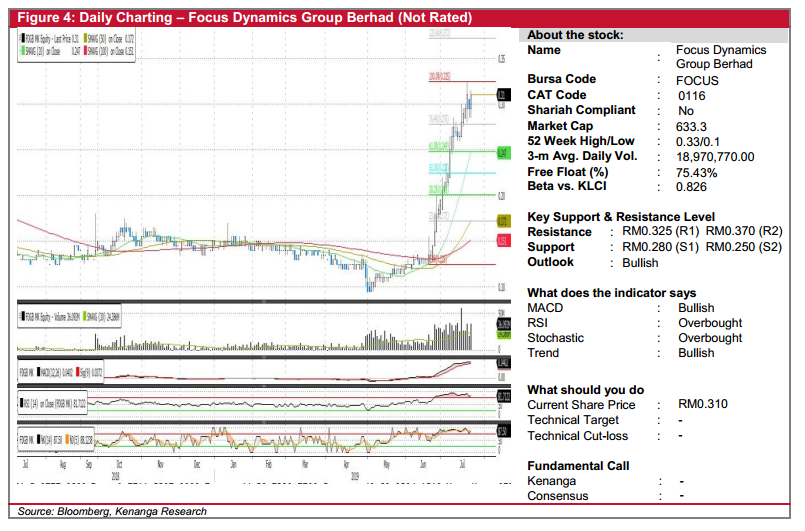
- FOCUS closed 1.5 sen higher (+5.08%) to end at RM0.310, yesterday.
- The share has been an impressive rally since breaking above its 100-day SMA in late June 2019. However, we opine that the candlesticks have expanded far ahead of its SMAs (especially the 100-day SMA) and that there should be some consolidation/pull back.
- Coupled with the fact that both RSI and Stochastic indicators have displayed overbought signals since late June 2019 (close to a month now), we believe a consolidation phase/pull back is likely.
- Key levels of support can be identified at RM0.280 (S1) and RM0.250 (S1), which we believe could be attractive points for investors to take on a position.
- However, should buying momentum persist, overhead resistances can be seen at RM0.325 (R1) and RM0.370 (R2).
Source: Kenanga Research - 23 Jul 2019
Related Stocks
| Chart | Stock Name | Last | Change | Volume |
|---|
Market Buzz
More articles on Kenanga Research & Investment
Actionable Technical Highlights - PRESS METAL ALUMINIUM HLDG BHD (PMETAL)
Created by kiasutrader | Nov 25, 2024
Actionable Technical Highlights - PETRONAS CHEMICALS GROUP BHD (PCHEM)
Created by kiasutrader | Nov 25, 2024
Weekly Technical Highlights – Dow Jones Industrial Average (DJIA)
Created by kiasutrader | Nov 25, 2024
Malaysia Consumer Price Index - Edge up 1.9% in October amid food price surge
Created by kiasutrader | Nov 25, 2024
Discussions
Be the first to like this. Showing 0 of 0 comments


