Daily Technical Highlights - (QES, YSPSAH)
kiasutrader
Publish date: Tue, 13 Oct 2020, 09:56 AM
QES Group Bhd (Trading Buy)
• QES – which specialises in the manufacturing, distribution and provision of engineering services for inspection, test, measuring, analytical and automated handling equipment – offers exposure to the fast-growing semiconductor industry.
• After experiencing a sharp drop in net profit to RM3.3m (-77% YoY) in FY19, the Group’s bottomline rebounded with net earnings of RM5.1m in 1HFY20 (up from RM0.3m previously).
• The Group is in a financially strong position with net cash holdings & short-term investments of RM48.8m (or 6.4 sen per share) as of end-June 2020. In addition, QES plans to raise an indicative amount of RM20.5m via a private placement exercise to be used for business expansions.
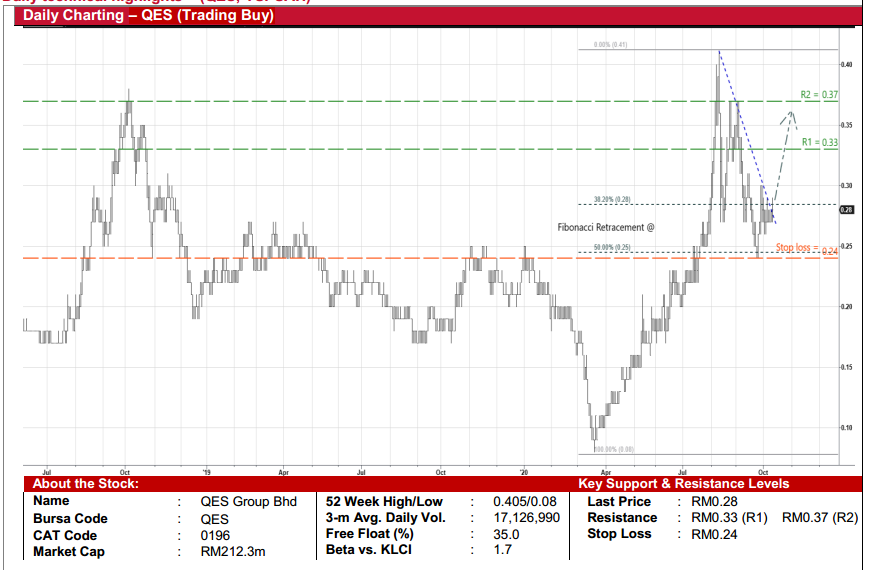
• From a technical viewpoint, QES’ share price ascent (from a trough of RM0.08 in March to peak at RM0.405 in August this year) has been temporarily disrupted following the stock’s subsequent pullback. Still, we reckon the share price uptrend remains intact as its price correction (to as low as RM0.235) is supported by the Fibonacci’s retracement level of 50%.
• A resumption of the uptrend will be forthcoming should the stock – which was actively traded yesterday – cut above a descending trendline convincingly. This could then push the share price towards our resistance hurdles of RM0.33 (R1; 18% upside potential) and RM0.37 (R2; 32% upside potential).
• Our stop loss level is pegged at RM0.24 (or 14% downside risk from yesterday’s closing price of RM0.28).

Y.S.P. Southeast Asia Holding Bhd (Trading Buy)
• YSPSAH, which is involved in the manufacturing and trading of various kinds of pharmaceutical and veterinary products with geographical exposure in more than 10 countries, is a proxy to the healthcare industry.
• The Group – whose bottomline has fluctuated between RM20m and RM30m p.a. in the past five years – is set to show strong earnings performance this year. It posted net profit of RM11.8m (+85% YoY) in 2QFY20, taking 1HFY20’s earnings to RM17.5m (+56% YoY).
• Its balance sheet is healthy too with net cash holdings of RM52.2m (or 37.4 sen per share) as of end-June this year.
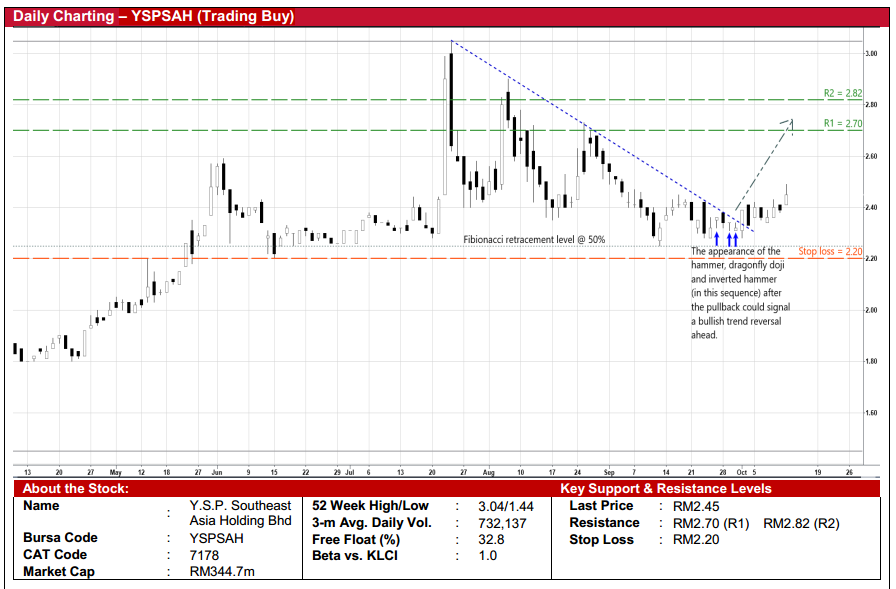
• Technically speaking, YSPSAH’s share price could be on the verge of resuming its uptrend after pulling back from a high of RM3.04 in July to a trough of RM2.25 in September this year (with the downslide being cushioned by the Fibonacci retracement level of 50% as measured from its March low to the July peak).
• This is backed by the appearance of the hammer, dragonfly doji and inverted hammer candlesticks recently following the price correction, which signal a probable bullish trend reversal.
• Riding on the upward momentum, the stock – which has just crossed above a negative sloping trendline – is expected to scale towards our resistance levels of RM2.70 (R1) and RM2.82 (R2), which represents upside potentials of 10% and 15%, respectively.
• We have set our stop loss level at RM2.20 (or 10% downside risk from its last traded price of RM2.45).
Source: Kenanga Research - 13 Oct 2020
Related Stocks
| Chart | Stock Name | Last | Change | Volume |
|---|
More articles on Kenanga Research & Investment
Created by kiasutrader | Nov 28, 2024


