Daily technical highlights – (HEVEA, VIS)
kiasutrader
Publish date: Thu, 03 Nov 2022, 12:01 PM

Heveaboard Bhd (Technical Buy)
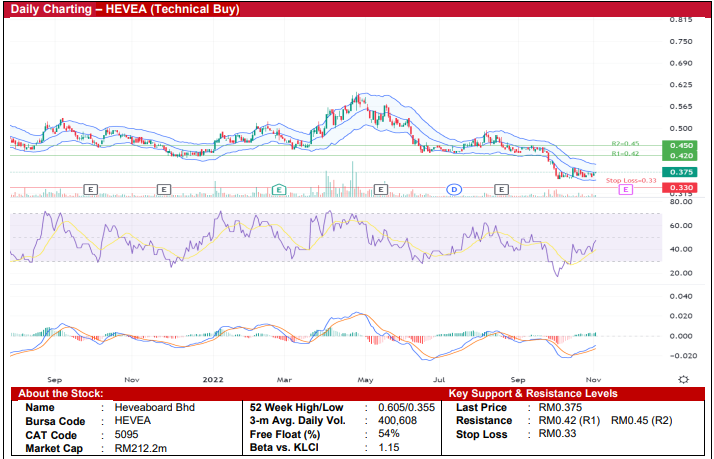
• From a peak of RM0.835 in December 2020, HEVEA’s share price has been trending downwards to form a sequence of lower highs and lower lows before closing at RM0.375 yesterday. With the share price likely to find support near its 52-week low of RM0.355, a technical rebound could be anticipated.
• Chart-wise, the rising momentum is expected to persist as: (i) the RSI indicator climbs out from the oversold zone, (ii) the 12-day moving average is still hovering above the 26-day moving average following the MACD golden cross in October, and (iii) the stock price has crossed back above the lower Keltner Channel earlier this month.
• Hence, we expect the stock to rise and test our resistance thresholds of RM0.42 (R1; 12% upside potential) and RM0.45 (R2; 20% upside potential).
• Conversely, our stop loss price has been identified at RM0.33 (representing a 12% downside risk).
• Fundamentally, HEVEA is involved in the particleboard business focusing on the manufacturing, trading and distribution of a wide range of particleboard, ready-to-assemble (RTA) products and fungi cultivation.
• Earnings-wise, the group reported a net profit of RM2.8m in 2QFY22, reversing from a net loss of RM3.9m in 2QFY21, driven by higher sales of value-added products and a favourable USD/MYR exchange rate. This took 1HFY22 bottomline to RM8m (versus a net loss of RM4.8m previously).
• Based on consensus forecasts, HEVEA’s net earnings are projected to come in at RM18.8m in FY December 2022 and RM25.3m in FY December 2023, which translate to forward PERs of 11.3x this year and 8.4x next year, respectively.
• The stock also offers dividend yields of 6.7% and 9.3% based on consensus DPS of 2.5 sen and 3.5 sen for FY22 and FY23, respectively.

VisDynamics Holdings Bhd (Technical Buy)
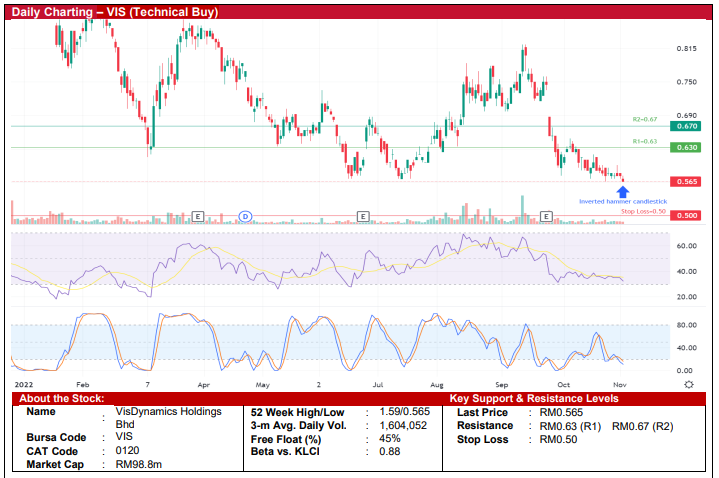
• A technical rebound could be on the horizon following VIS’ share price retracement from its peak RM1.69 in late September 2021 to as low as RM0.565 currently (a 52-week low).
• On the chart, the share price is expected to shift higher as both the stochastic and RSI indicators are anticipated to climb out from the oversold area following the appearance of a bullish inverted hammer candlestick yesterday.
• A technical breakout could then lift the stock to challenge our resistance levels of RM0.63 (R1; 12% upside potential) and RM0.67 (R2; 19% upside potential).
• Our stop loss level is pegged at RM0.50 (representing a 12% downside risk).
• Fundamentally speaking, VIS is engaged in the business of manufacturing automated test equipment involving the design, assembly, research and development of back-end semiconductor equipment.
• Earnings-wise, the group reported a net profit of RM1.3m in 3QFY22 compared with a net profit of RM4m in 3QFY21, which brought 9MFY22 net profit to RM7.3m (versus net profit of RM7.7m in 9MFY21).
• In terms of valuation, the stock is currently trading at Price/Book Value multiple of 1.6x (or approximately 1 SD below its historical mean) based on a book value per share of RM0.35 as of end-July 2022.
Source: Kenanga Research - 3 Nov 2022
Related Stocks
| Chart | Stock Name | Last | Change | Volume |
|---|
More articles on Kenanga Research & Investment
Created by kiasutrader | Nov 22, 2024


