


Kenanga Research & Investment
Weekly Technical Highlights – Dow Jones Industrial Average (DJIA)

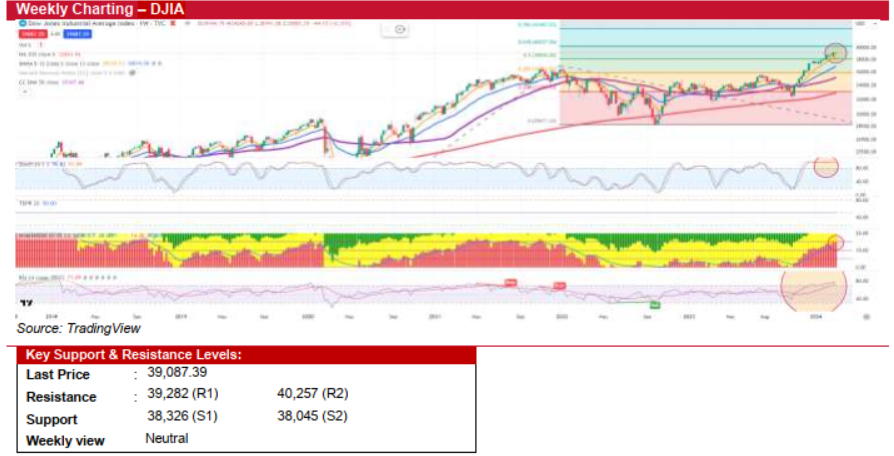
Dow Jones Industrial Average (DJIA) (Neutral)
- Last week, the U.S. stock market experienced a general uptrend, fuelled by excitement in AI and small-cap stocks. Despite a slight 0.1% dip in the Dow Jones Industrial Average, influenced by stocks like Apple and UnitedHealth, it remains near alltime highs. The S&P 500 rose by 0.9%, reaching a new record on Friday, while the Nasdaq composite increased by 1.7%, achieving its first record high since November 2021. S&P 500 companies reported an average earnings growth of 4.0% YoY for the 4QCY23, as per FactSet data. This increase marks the second consecutive YoY earnings rise, following a 4.7% gain in 3QCY23.
- The US Federal Reserve is set to release its Beige Book on Thursday, providing insights into economic activities nationwide. Concurrently, the DJIA is expected to continue its upward trend but may enter a consolidation phase at its current or slightly higher levels over the next week. This period is likely to see a wider trading range, attributed to anticipated increases in volatility, potentially spurred by growing geopolitical tensions in the Middle East.
- Technically-speaking, the DJIA's weekly chart highlights an ongoing uptrend, symbolizing continuous market optimism and increased investor interest, as evidenced by the steady performance of the MCDX's banker chip. However, the appearance of a 'doji' candlestick pattern last week suggests a potential reversal might be approaching. Additionally, while the weekly RSI stands at 75.72, indicating a slightly overbought condition, a narrowing histogram points towards a possible negative crossover in the near future.
- In short, this week's market outlook is cautiously optimistic, though higher volatility is anticipated. Key resistance levels are marked at the recent highs of 39,282 and 40,257. Conversely, should the market fall below the 5-week SMA support level of 38,326, a pullback might occur, potentially leading to bargain hunting around the 38,045 mark, which corresponds to the 50% Fibonacci extension level.
Source: Kenanga Research - 4 Mar 2024
More articles on Kenanga Research & Investment
Bond Market Weekly Outlook - MGS/GII yields set for modest rise amid global uncertainty
Created by kiasutrader | Dec 27, 2024
- Ringgit Weekly Outlook Eyes stability amid USD resilience and domestic optimism
Created by kiasutrader | Dec 27, 2024
Actionable Technical Highlights - RANHILL UTILITIES BHD (RANHILL)
Created by kiasutrader | Dec 23, 2024
Actionable Technical Highlights - HUP SENG INDUSTRIES BHD (HUPSENG)
Created by kiasutrader | Dec 23, 2024
Discussions
Be the first to like this. Showing 0 of 0 comments
Post a Comment
Featured Posts


Latest Videos


Apps


Top Articles
2
Mercury Securities Research
3
THE INVESTMENT APPROACH OF CALVIN TAN
SUPERMAX VERSUS TOPGLOVE, KOSSAN & HARTA, Compare & Contrast, By Calvin Tan
5
THE INVESTMENT APPROACH OF CALVIN TAN
UNDERSTANDING THE UPCOMING ELECTRICITY TARIFF BY TENAGA NATIONAL, Calvin Tan
6
7
Stock Market Enthusiast
Technical Outlook - GAMUDA (Uptrend Intact After FBMKLCI Inclusion) - #GAMUDA
8
Good Articles to Share
#
Stock
Score
Daily Stocks
Stock Name
Last
Change
Volume
Stock Name
Last
Change
Volume
Stock Name
Last
Change
Volume
MQ Trading Signals
Stock
Time
Signal
Duration
Stock
Time
Signal
Duration
Featured Advertisers / Partners


Ride The Bull Short The Bear
CS Tan
4.9 / 5.0
This book is the result of the author's many years of experience and observation throughout his 26 years in the stockbroking industry. It was written for general public to learn to invest based on facts and not on fantasies or hearsay....