


Good Articles to Share
COMMENTS ON AXIATA GROUP BERHAD (6888) - louisesinvesting

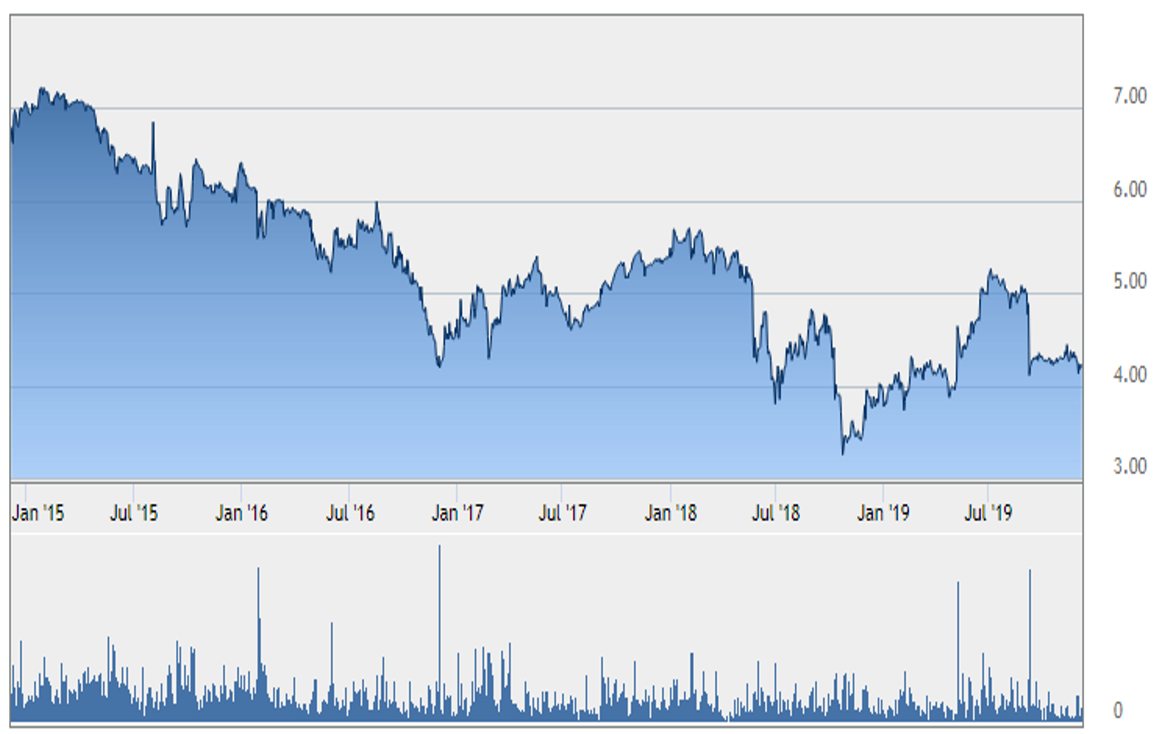
FIGURE 1: AXIATA GROUP BERHAD LAST 5 YEARS SHARE PRICE TREND
**analysis based on 2018 annual report.
1. GENERAL INTRO: Axiata, which is the parent company of Celcom, is one of the major mobile network providers in Malaysia.
2. NOTABLE POINTS:
a. different from other operators who mainly operate in Malaysia, Axiata operates in 6 countries, including Malaysia, Indonesia, Sri Lanka, Bangladesh, Cambodia, and Nepal, in 2018 report, it declares a customer base of 149 million
b. for its Malaysia at Celcom, reported prepaid (average-rate-per-user) ARPU is RM35, postpaid ARPU is RM89, blended ARPU RM49
c. in 2018 financial year, overall CAPEX was RM6670 million
3. IS THIS COUNTER A STRONG GROWTH STOCK?
a. REVENUE RANGE (million): ~23885 million in 2018 annual report, this is a high revenue company.
b. SHARE PRICE: from 2015-2019, share price is decreasing from around RM7 to around RM4
c. EARNING PER SHARE (EPS): earning per share in last 5 years decreased from 27.2 to -55.4sen, Losses reported in 2018 was due to impairment losses from its Indian associate company Idea's merger with Vodafone.
d. FUTURE POTENTIAL/PROSPECTS: quite dependable and reliable counter, share price expected to be stable.
e. CAPITAL EXPENDITURE (CAPEX): spending on purchase of new fixed assets is RM 6670 million, around 14% of total assets.
4. IS THIS A STRONG DIVIDEND STOCK?
a. DIVIDEND YIELD: in 2018 report, Axiata declared a total dividend payout of 9.5 sen per share, amounts to dividend yield of 2.26 % based on current share price.
b. CONSISTENCY: consistent dividend payout, last five years (2015-2019) dividends declared range between 8 to 22 sen per share.
c. DIVIDEND PAYOUT RATIO: in 2018 financial year, Axiata paid out about 85% of its earnings to investors in the form of dividend. The payout ratio ranged from 50-85% in last five years.
5. IS THE MANAGEMENT PERFORMANCE GOOD?
a. RETURN ON EQUITY (ROE): in 2018 financial year, Axiata achieved a very poor return of shareholders’ equity, at -3.77%, due to its associate company’s impairment losses.
b. COST-TO-INCOME RATIO: cost-to-income ratio is high at about -649%.
6. OTHER INDICATORS:
a. CASH FLOW: cash flow is positive, around RM 3787 million, equivalent to RM 0.42 per share
b. SUPPORT BY INSTITUTIONAL INVESTORS: this counter is very well supported by institutional investors, there are 30 institutional investors at top 30 major shareholders list, including EPF (16.16%) and PERMODALAN NASIONAL BERHAD (1.49%), SKIM AMANAH SAHAM BUMIPUTERA (11.93%), KUMPULAN WANG PERSARAAN (4.1%), KHAZANAH NASIONAL BERHAD (36.21%) and insurance companies and investment funds.
Disclaimer: The content of the blog posts are for sharing purpose only. Readers are encouraged to carry out further research and analysis as well as follow up latest update information before making any investment decisions.
http://louisesinvesting.blogspot.com/2019/12/comments-on-axiata-group-berhad-6888.html
Related Stocks
| Chart | Stock Name | Last | Change | Volume |
|---|
More articles on Good Articles to Share
Eli Lilly CEO on Fighting Cancer and Obesity, Drug Pricing (Correct)
Created by Tan KW | Jan 14, 2025
'Fast Money' traders talk tech sliding and if its a sign of more downturn or a market refresher
Created by Tan KW | Jan 14, 2025
GRAPHIC WARNING: 'Breakthrough' in Gaza truce talks as final draft presented -official | REUTERS
Created by Tan KW | Jan 14, 2025
Tens of thousands demonstrate in nationwide strike in Belgium | REUTERS
Created by Tan KW | Jan 14, 2025
Discussions
Be the first to like this. Showing 0 of 0 comments
Post a Comment
Featured Posts


Latest Videos


MQ Trading Signals
Time
Signal
Duration
Type
2025-01-31 16:50:00
EMA 5
5 Mins
SELL
2025-01-31 16:40:00
TURTLE SYSTEM 20
10 Mins
SELL
2025-01-31 16:40:00
TURTLE SYSTEM 55
10 Mins
SELL
2025-01-31 16:40:00
TURTLE SYSTEM 20
5 Mins
SELL
2025-01-31 16:40:00
TURTLE SYSTEM 55
5 Mins
SELL
Apps


Top Articles
1
Dragon Leong blog
2
Stock Market Enthusiast
Feng Shui Market Outlook for FBM KLCI in the Year of the Wood Snake (2025)
3
Stock Market Enthusiast
3 Resilient Stocks That Defied Malaysia’s Market Slump in January 2025 - #GCB, #ABMB, #CDB
4
The Alpha Trader
5
Kenanga Research & Investment
Oil & Gas - Dissecting Petronas and Trump's Impact on the Sector (OVERWEIGHT)
6
Rakuten Trade Research Reports
7
TA Sector Research
8
MQ Market Updates
#
Stock
Score
Daily Stocks
Stock Name
Last
Change
Volume
Stock Name
Last
Change
Volume
Stock Name
Last
Change
Volume
Featured Advertisers / Partners


Ride The Bull Short The Bear
CS Tan
4.9 / 5.0
This book is the result of the author's many years of experience and observation throughout his 26 years in the stockbroking industry. It was written for general public to learn to invest based on facts and not on fantasies or hearsay....