


KLCI : Mutlti Year Bull Run
KLCI : Mutlti Year Bull Run

The fund flow always provides u early signal the movement of underlying. Fundamental always come late by many months...
The chart of USDMYR and MYRUSD telling you KLCI is heading a multi year bull run. 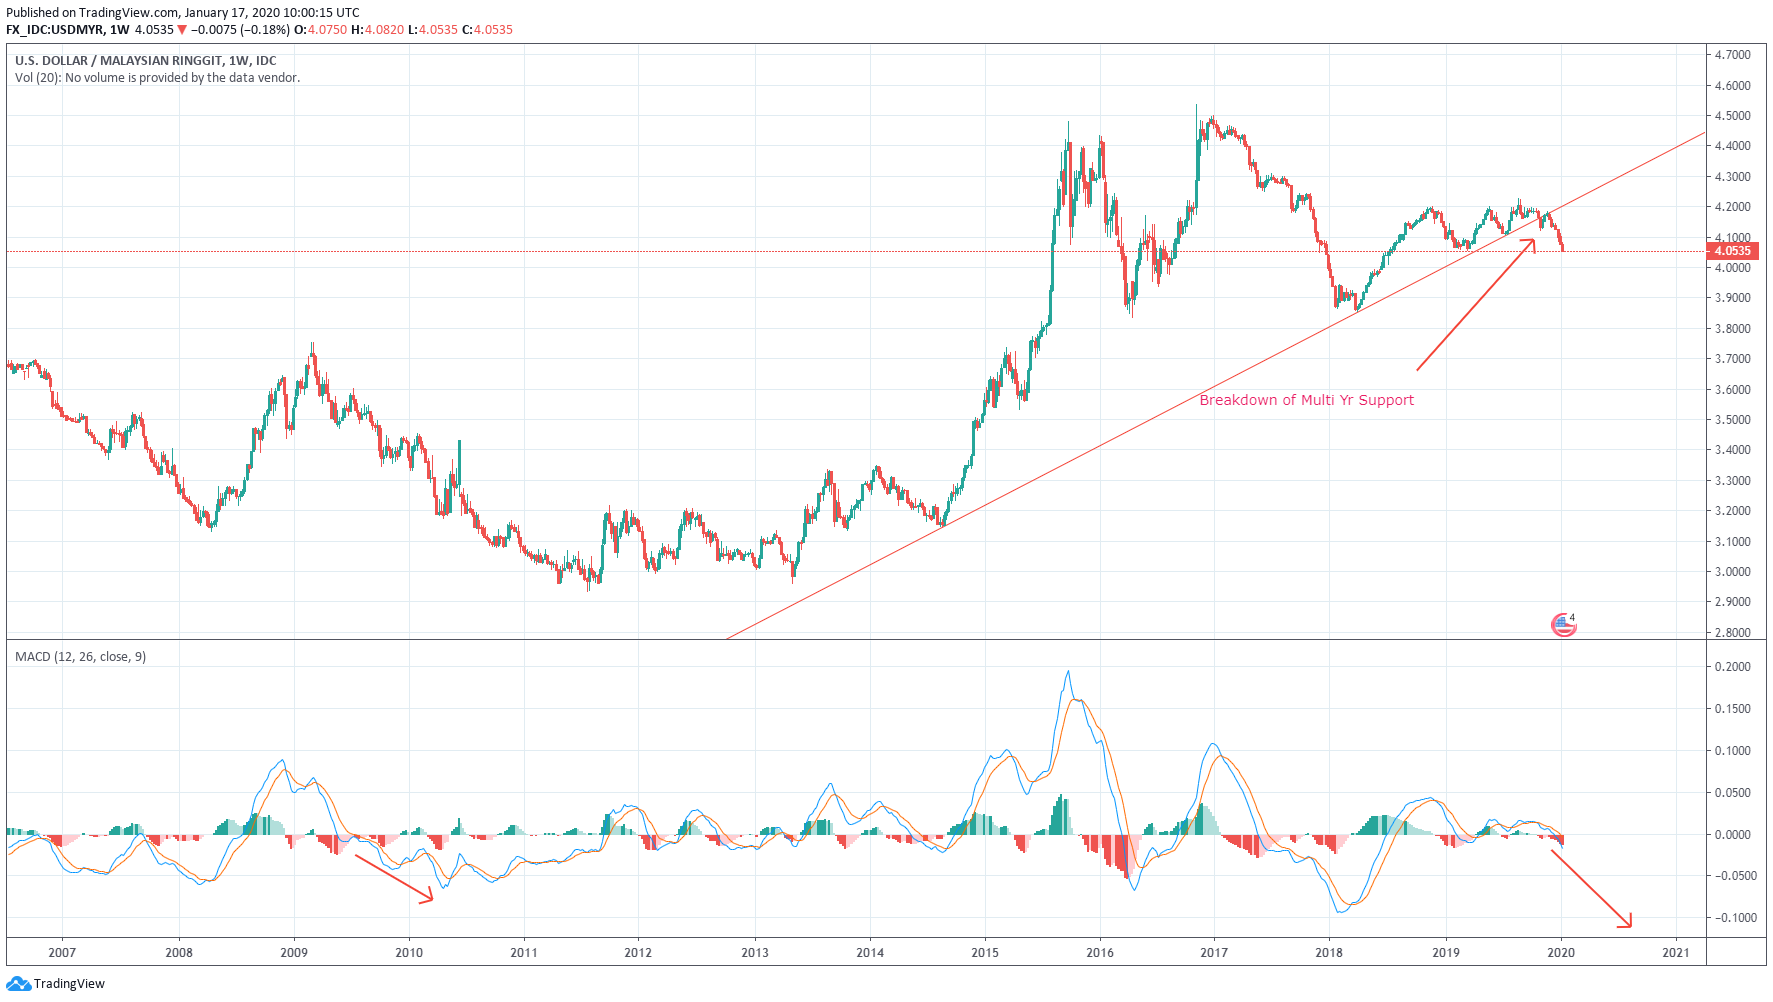
The weekly macd of USDMYR begin to trend below zero line. This is same as 2Q of 2009. The magnitiude of downside likely to be much bigger than 2009 given that the breakdown of major neckline support. You could see the HS pattern with a multi year jumpo head. This breakdown will give you a target of at least below 2011 low.
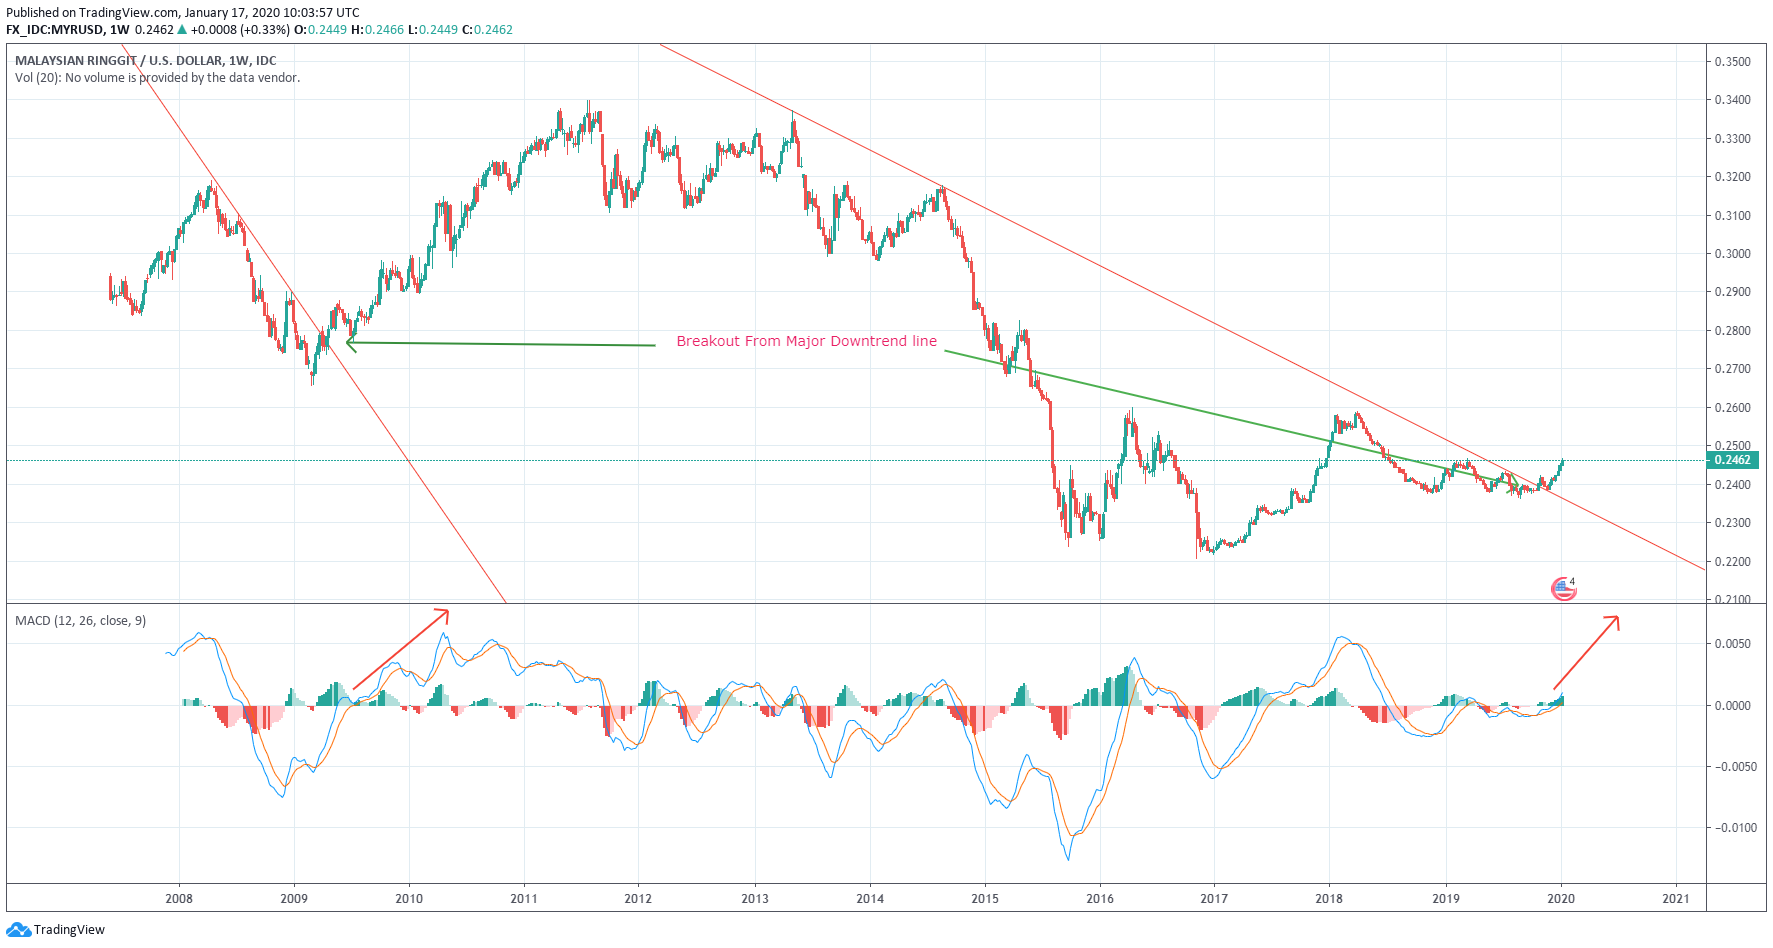
From the MYRUSD chart, weekly MACD begin to trend above zero line (Bull Run). From chart, you could see there are 2 major downtrend lines. The 2014-2019 downtrend line is about 3x of 2007/08. Current breakout telling you the upside resistance is equivalent to KLCI around 1900 point.
Featured Posts
Introducing MY's First IPO Fund for Sophisticated Investors!
New Update. Discover investment communities that resonate with your ideas
M & A Value Partners IPO Equity Fund has been launched - Targeted 13% Return p.a
Latest Videos


Apps


Top Articles
1
2
南洋行家论股
3
CEO Morning Brief
Oriental Kopi to Raise Menu Prices Amid Rising Raw Material Costs
4
AmInvest Research Reports
5
Good Articles to Share
Trudeau’s exit, Musk v Starmer, Nvidia’s new tech and Biden’s drilling ban
6
Good Articles to Share
Powerful earthquake kills dozens in Tibet, rattles Nepal | REUTERS
7
Good Articles to Share
CES 2025: Sony Afeela electric vehicle starts at $89,900 | REUTERS
8
Good Articles to Share
#
Stock
Score
Daily Stocks
Stock Name
Last
Change
Volume
Stock Name
Last
Change
Volume
Stock Name
Last
Change
Volume
MQ Trading Signals
Stock
Time
Signal
Duration
Stock
Time
Signal
Duration
Featured Advertisers / Partners


Ride The Bull Short The Bear
CS Tan
4.9 / 5.0
This book is the result of the author's many years of experience and observation throughout his 26 years in the stockbroking industry. It was written for general public to learn to invest based on facts and not on fantasies or hearsay....
TheContrarian
Sssssssshhhhhhhhhhhhh
2020-01-17 19:09