


Lim's Blog
Muda Holdings Bhd

Based on the daily chart , Muda Holdings is still moving in accumulation stage. Based on Volume Spread Analysis, we spotted the Smart Money is buying slowly at the support level . Below are the signals of accumulation by Smart Money:
1. Price immediately moved sideways after the Sell-Off bar with high volume indicating the end of distribution
2. Volume getting lower on the 2nd bottom at support level (RM1.52)
3. Lots of narrow spread bar with low volume . Smart Money is buying slowly at the bottom without pushing the prices up.
4. Lots of hidden potential buying at the support level . As spotted in the chart (Spring, Test and LC )
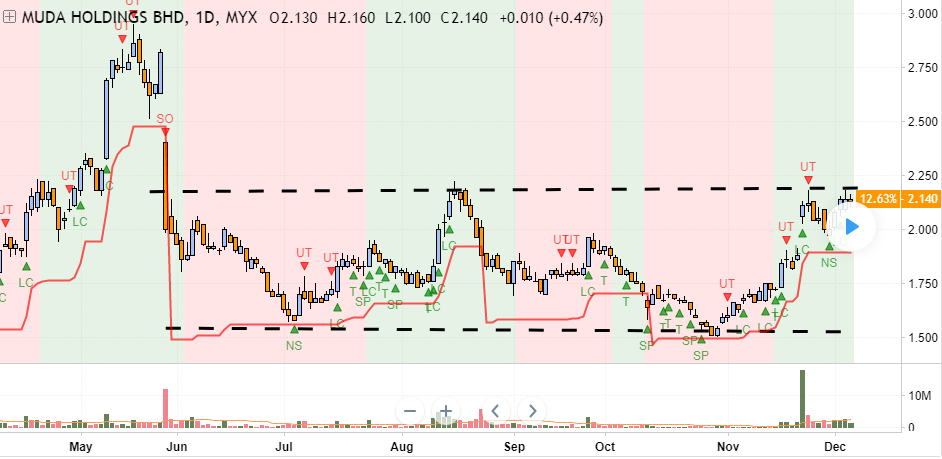
However, based on today chart (6 December), price still failed to break above the resistance level . Notice there is a sign of weakness (UT) which indicating seller still in the market. Once Smart Money spotted sellers at the resistance, they might avoid the price level. Smart Money won’t absorb this supply at higher levels. This is why we often saw shakeouts and whipsawing in the accumulation stage because the cost is lower to buy at support level .
Price is likely to pullback to support level , traders can look for Shakeout signals for low risk trade. Example of Shakeout signal Spring.
Send us your preference stock to review based on TradeVSA chart by comment at below.
Disclaimer
This information only serves as reference information and does not constitute a buy or sell call. Conduct your own research and assessment before deciding to buy or sell any stock.
Related Stocks
| Chart | Stock Name | Last | Change | Volume |
|---|
Market Buzz
More articles on Lim's Blog
Discussions
Be the first to like this. Showing 1 of 1 comments
Post a Comment
Featured Posts
Introducing MY's First IPO Fund for Sophisticated Investors!
New Update. Discover investment communities that resonate with your ideas
M & A Value Partners IPO Equity Fund has been launched - Targeted 13% Return p.a
Latest Videos


Apps


Top Articles
1
Stock Market Enthusiast
YTLPower: Hammer + Oversold + Strong Support Level Means Bullish Reversal?
2
CEO Morning Brief
These Big-cap Stocks on Bursa Pay More Than 5% Dividend Yield
3
Mercury Securities Research
4
5
Kenanga Research & Investment
6
RHB Investment Research Reports
7
AmInvest Research Reports
8
M+ Online Research Articles
#
Stock
Score
Daily Stocks
Stock Name
Last
Change
Volume
Stock Name
Last
Change
Volume
Featured Advertisers / Partners


Ride The Bull Short The Bear
CS Tan
4.9 / 5.0
This book is the result of the author's many years of experience and observation throughout his 26 years in the stockbroking industry. It was written for general public to learn to invest based on facts and not on fantasies or hearsay....
celaw0412
Hi, mind to share updated analysis?
2018-12-17 08:24