Ho Hup Construction (5169) - Double-Bottom Break-out
MercurySec
Publish date: Tue, 30 Jul 2024, 09:17 AM
Technical Highlights
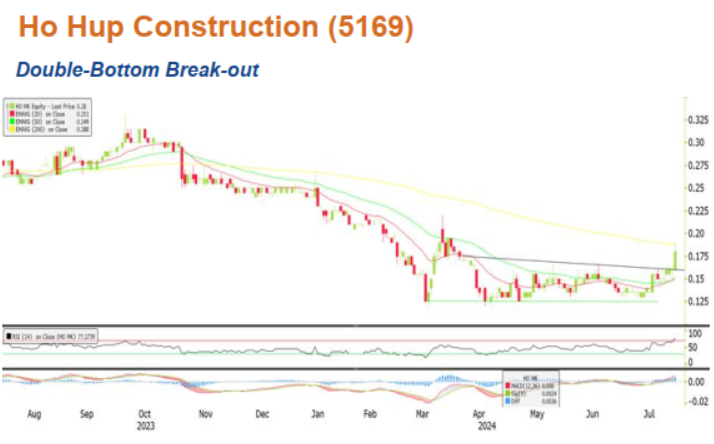
A consistent pattern of higher highs and higher couple with the surge in the share price has sent the stock to trade above all its EMA lines. More upside may be in the cards especially with the formation of a large green candle at closing, breaking through the neckline of a 16-month long double-bottom pattern with substantial trading volume (8.6x more than its average 90-day trading volume).
The upward pointing RSI line that crossover into the overbought territory today indicates positive momentum going forward. Likewise, the short-term bullishness is ascertained by the upward-pointing 20-EMA line.
With the share price breaking through the neckline of the double-bottom pattern at RM 0.160, we think the stock could potentially test the resistance at RM0.205 first and subsequently at RM0.250 (determined by the difference of RM0.045 between the high and low of the double bottom pattern). Conversely, a dip below RM0.150 could signify the start of a correction phase.
Entry – RM-0.180 – RM0.190
Stop Loss – RM0.145
Target Price – RM0.205 – RM0.250
Source: Mercury Securities Research - 30 Jul 2024
Related Stocks
| Chart | Stock Name | Last | Change | Volume |
|---|


