


Mercury Securities Research
Hartalega (5168) - Breakout Confirmed, Strong Volume

MercurySec
Publish date: Tue, 04 Feb 2025, 08:30 AM
MercurySec
0 521
An official blog in i3investor to publish research reports provided by Mercury Securities Research team.
All materials published here are prepared by Mercury Securities Sdn. Bhd.
Mercury Securities Sdn. Bhd.
L-7-2, No.2, Jalan Solaris,
Solaris Mont Kiara, 50480, Kuala Lumpur
Tel: 603-6203 7227
Email: mercurykl@mersec.com.my
All materials published here are prepared by Mercury Securities Sdn. Bhd.
Mercury Securities Sdn. Bhd.
L-7-2, No.2, Jalan Solaris,
Solaris Mont Kiara, 50480, Kuala Lumpur
Tel: 603-6203 7227
Email: mercurykl@mersec.com.my
Technical Highlights
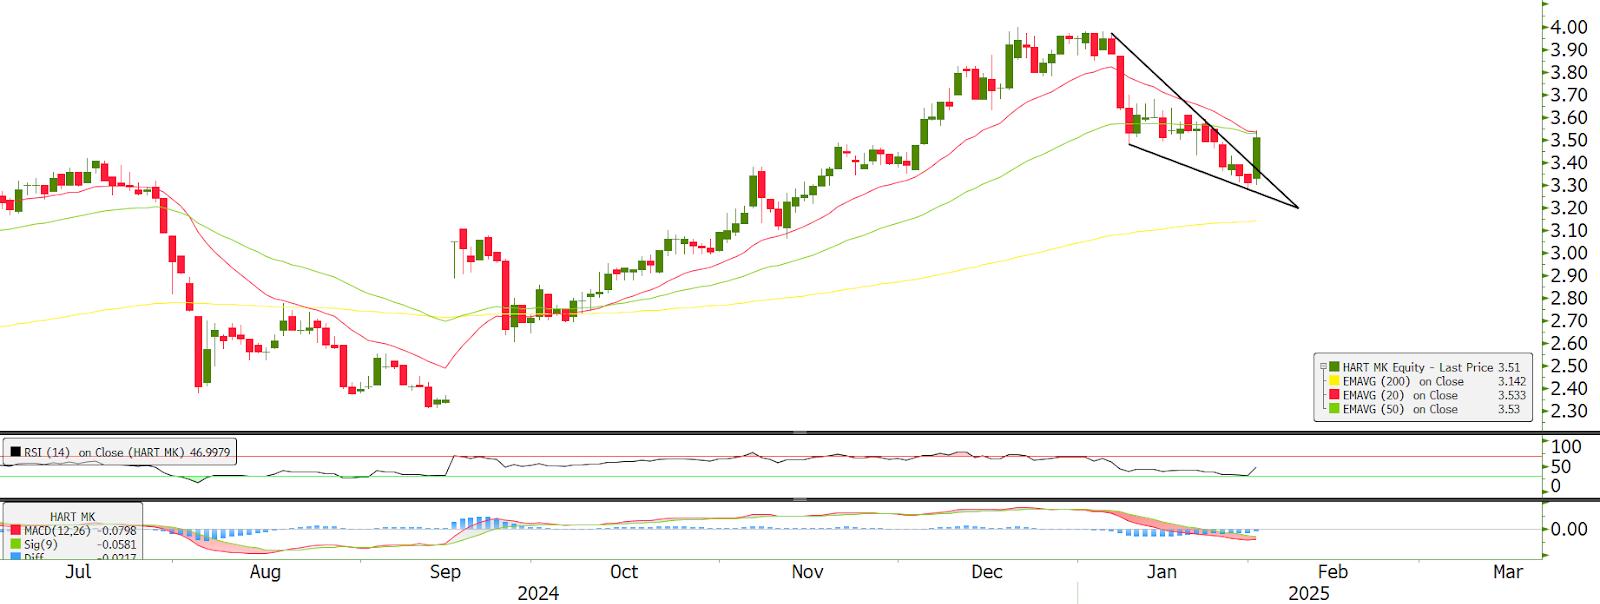
The stock hit a bottom in September 2024 and has been on an uptrend since, reaching a new 52-week high of RM4.11 in December. However, after that peak, it started moving downward, breaking out from the previous uptrend. Despite this, the stock formed a triangle pattern, and just yesterday, it successfully broke out of this pattern with strong volume-the highest since November 2024. Adding to the positive sentiment, the stock is still trading above the 200-day EMA, though it will soon face resistance at the 20-day and 50-day EMAs.
Momentum indicators are also showing strength. The RSI is at 46 and rebounding sharply after two months of neutral momentum, indicating buyers are stepping in. Meanwhile, the MACD is on the verge of forming a golden cross as selling pressure continues to decline.
For an ideal entry, the stock looks attractive between RM3.48 and RM3.52. The first resistance is at RM3.61, and if broken, the next target is RM3.78. A successful breakout above both would put the stock on track to challenge the 52-week high near RM3.97. On the downside, if the stock falls below RM3.28 (2nd support level), this would indicate a false breakout and the stock could continue to trend downwards.
Entry - RM3.48 - RM3.52
Stop Loss - RM3.28
Target Price - RM3.61 - RM3.78 - RM3.97
Source: Mercury Securities Research - 4 Feb 2025
Related Stocks
| Chart | Stock Name | Last | Change | Volume |
|---|
More articles on Mercury Securities Research
Discussions
Be the first to like this. Showing 0 of 0 comments
Post a Comment
Featured Posts
Introducing MY's First IPO Fund for Sophisticated Investors!
New Update. Discover investment communities that resonate with your ideas
M & A Value Partners IPO Equity Fund has been launched - Targeted 13% Return p.a
Latest Videos


Apps


Top Articles
1
THE INVESTMENT APPROACH OF CALVIN TAN
REPOSTING: BUSINESSES THAT LAST TILL THE END OF TIME IN BIBLE PROPHECY, Calvin Tan Blog
2
THE INVESTMENT APPROACH OF CALVIN TAN
3
Double Swords 双剑论股
4
TA Sector Research
5
Initial Public Offering (IPO)
6
MQ Market Updates
7
Stock Market Enthusiast
8
RHB Investment Research Reports
#
Stock
Score
Daily Stocks
Stock Name
Last
Change
Volume
Stock Name
Last
Change
Volume
Stock Name
Last
Change
Volume
Featured Advertisers / Partners


Ride The Bull Short The Bear
CS Tan
4.9 / 5.0
This book is the result of the author's many years of experience and observation throughout his 26 years in the stockbroking industry. It was written for general public to learn to invest based on facts and not on fantasies or hearsay....