MyEG Services (0138) - The Final Squeeze
MercurySec
Publish date: Fri, 23 Aug 2024, 09:52 AM
Technical Highlights
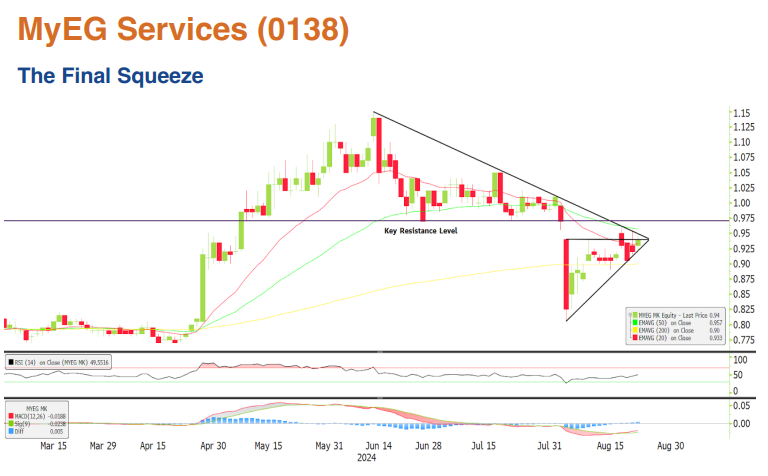
The stock has been in a downward phase since hitting a 52-week high in mid-June, forming a macro triangle pattern with strong resistance along the upper trendline, which has been tested four times without a breakout. Within this larger pattern, an ascending triangle is also forming, signaling that a breakout could be imminent. The stock is currently trading above both the 20-day and 200-day EMAs, but remains just below the 50-day EMA.
Momentum indicators further support this bullish sentiment. The RSI is currently moving upward, indicating increasing buying pressure. Meanwhile, the MACD formed a golden cross last week and continues to rise. Additionally, volume has also been steadily increasing.
At this stage, the key focus is on waiting for a breakout and confirming the move. The stock faces a crucial resistance level at RM 0.97, which has flipped from support to resistance after four failed bouncing attempts. Should the stock break through this level, the next resistance will be at RM 1.05, close to the 52-week high. Breaking this could trigger further buying interest and potentially signal the continuation of the uptrend. However, if the stock dips below RM 0.85, it could enter a correction phase.
Entry – RM0.93 – RM0.96
Stop Loss – RM0.85
Target Price – RM0.97 – RM1.05
Source: Mercury Securities Research - 23 Aug 2024
Related Stocks
| Chart | Stock Name | Last | Change | Volume |
|---|


