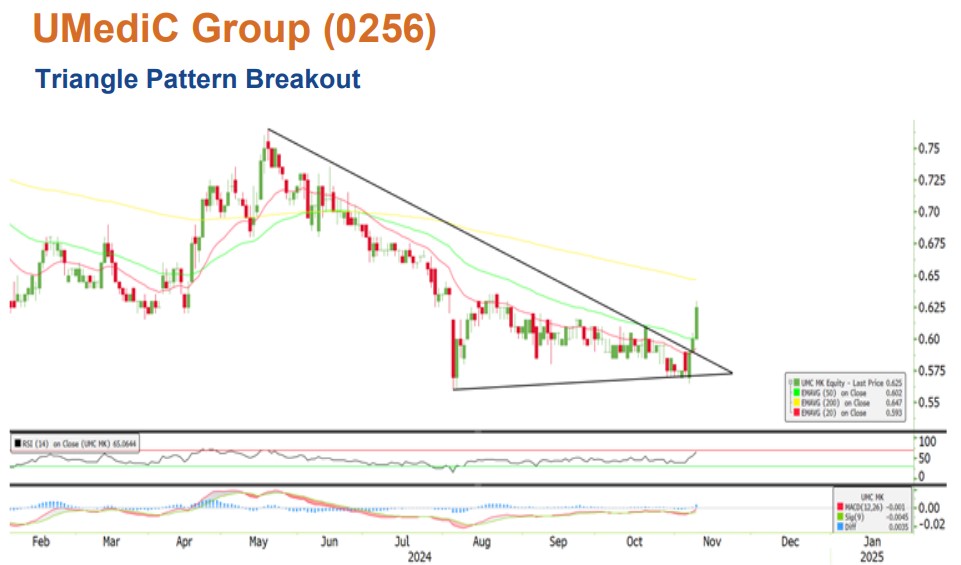
UMediC Group (0256) - Triangle Pattern Breakout
MercurySec
Publish date: Mon, 11 Nov 2024, 11:57 AM
Technical Highlights
Multiple uptrend movements pushed the stock higher toward its 52-week high before it entered into a consolidation phase. During this period, the stock made several trend reversal attempts, but weak buying interest caused each attempt to fall short. Recently, however, renewed buying interest has sparked a substantial recovery, driving the stock higher and resulting in a breakout from the triangle pattern, with the stock now trading above its 50-day EMA. These indicators are signalling that the stock may be entering a positive uptrend ahead.
Momentum indicators are favourable. The RSI is recovering gradually from the recent sideways movement, indicating buying interest is accumulating. Similarly, a golden cross was displayed in the MACD indicator recently, signalling the build-up of positive momentum.
An ideal entry point lies in the range between RM0.610 and RM0.625. The first resistance level to watch is RM0.640. A potential breakout from this point would form a stage for the stock to test its subsequent resistance level at RM0.695. Conversely, consolidation could happen if the stock dip below its recent support level at RM0.600.
Entry – RM0.610 – RM0.625
Stop Loss – RM0.580
Target Price – RM0.640 – RM0.695
Source: Mercury Research - 11 Nov 2024
Related Stocks
| Chart | Stock Name | Last | Change | Volume |
|---|
More articles on Mercury Securities Research
Created by MercurySec | Jan 22, 2025


