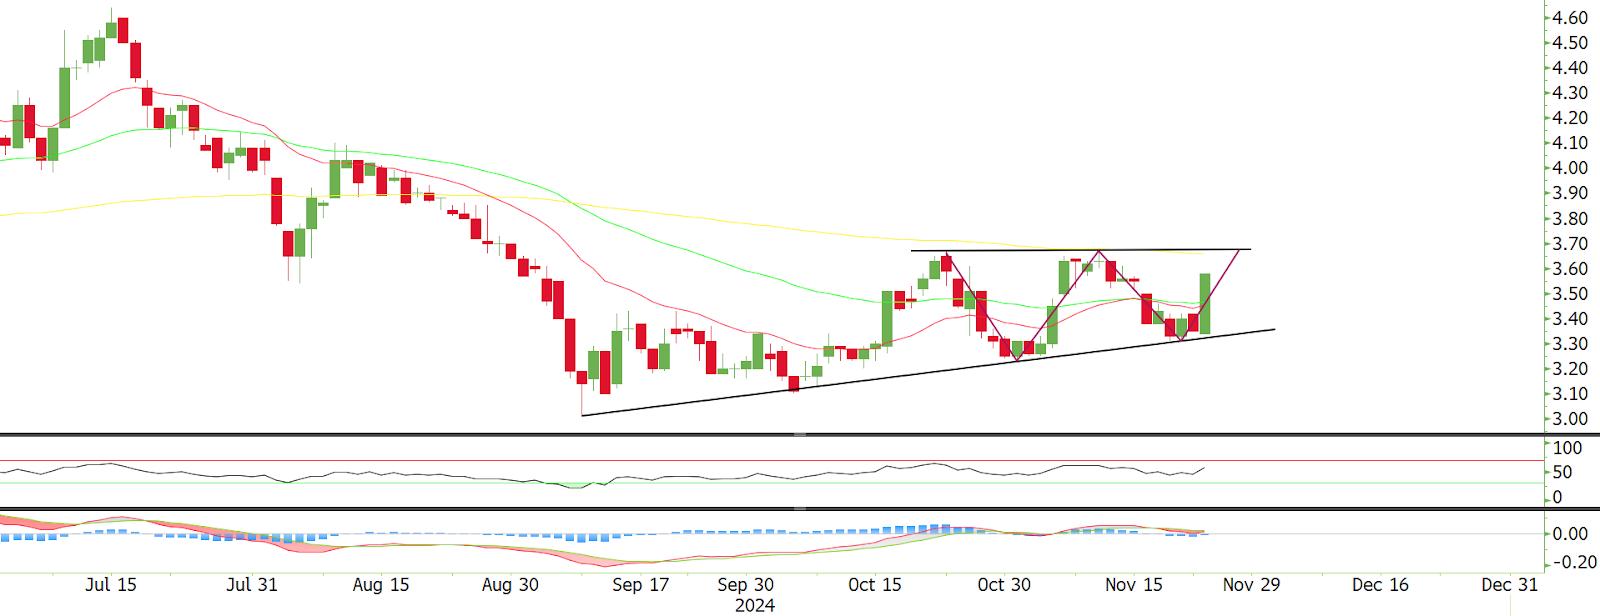
Vitrox (0097) - Bullish W-Pattern in Formation
MercurySec
Publish date: Tue, 26 Nov 2024, 03:12 PM

Technical Highlights
The stock experienced a downtrend from June 2024, reaching its trough in September. Since then, it has reversed into an uptrend and is now forming a bullish W-shaped pattern, with the ceiling of the pattern at RM3.67. The stock is currently trading above the 20-day and 50-day EMAs, but a key test lies ahead as it approaches the 200-day EMA.
Momentum indicators support this bullish outlook, with the MACD nearing a golden cross, signalling strengthening upward momentum. The RSI is at 56, reflecting moderate bullish sentiment, while increasing buying pressure is evident from rising volume levels.
An ideal entry range lies between RM3.52 and RM3.58, with the first resistance at RM3.67, aligning with the W-pattern ceiling and the 200-day EMA. A successful breakout could see the stock rally toward the next resistance at RM3.88. Conversely, if the stock falls below RM3.34, it would break the uptrend line, indicating the start of a correction and a potential shift in momentum.
Entry - RM3.52 - RM3.58
Stop Loss - RM3.34
Target Price - RM3.67 - RM3.88
Source: Mercury Securities Research - 26 Nov 2024
Related Stocks
| Chart | Stock Name | Last | Change | Volume |
|---|
More articles on Mercury Securities Research
Created by MercurySec | Jan 22, 2025


