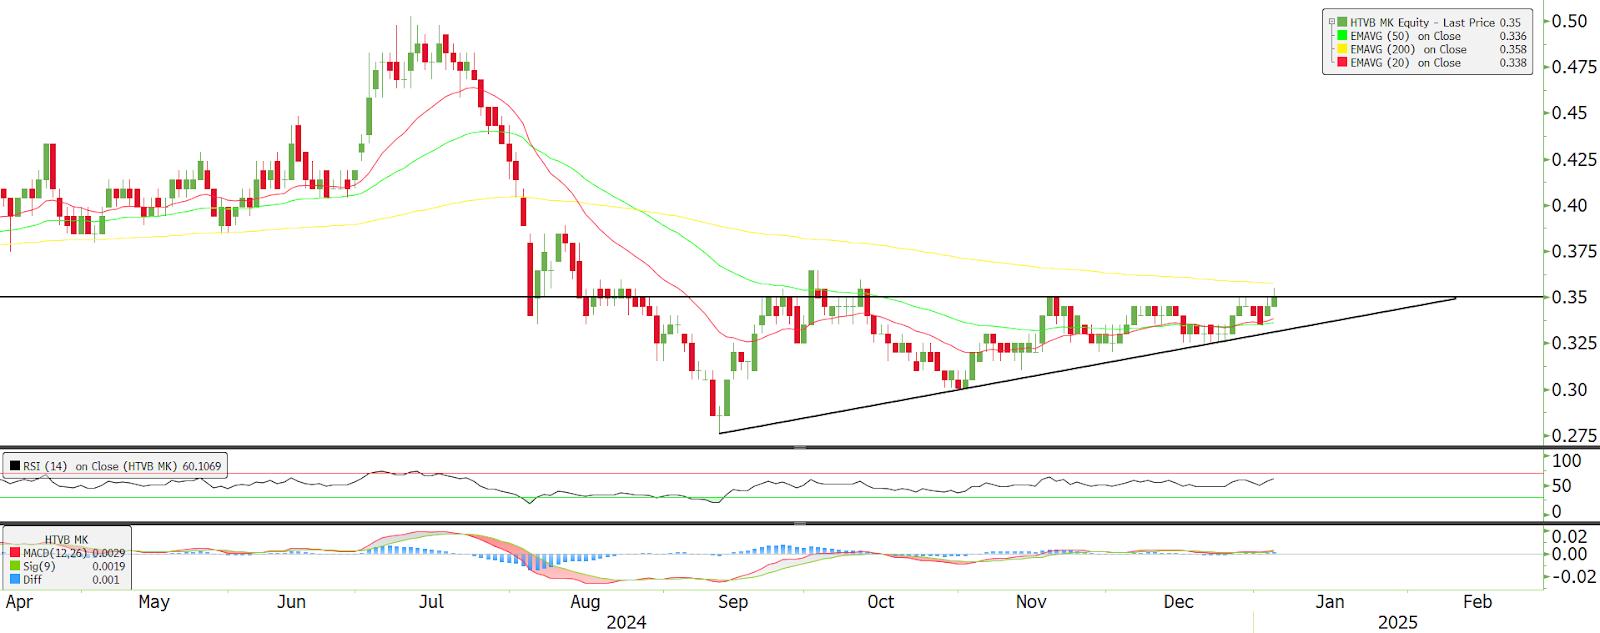
Hiap Teck (5072) - Ready for a Triangle Breakout
MercurySec
Publish date: Tue, 07 Jan 2025, 08:40 AM

Technical Highlights
The stock hit its peak in July 2024 before declining to its 52-week low at RM0.28. Since then, it has been forming a triangle pattern, attempting to break out of the key resistance zone between RM0.355 and RM0.365. Currently, the stock is in a squeeze zone, a clear sign that a breakout could be imminent. We also observe through the volume that bullish momentum has been building steadily since November 2024, signalling growing buyer interest. Moreover, the stock is now trading above both the 20-day and 50-day EMAs and is inching closer to the critical 200-day EMA, which, if crossed, could trigger more buying interest.
Momentum indicators are also aligning with this bullish setup. The RSI is at 56 and climbing. Similarly, the MACD has been trending upward, reflecting stronger momentum.
A good range would be between RM0.340 and RM0.350. The first key resistance is at RM0.365, which coincides with the 200-day EMA. If this level is successfully cleared, the next resistance level to watch is RM0.390. On the downside, if the stock falls below RM0.325, it would signal that selling pressure on RM0.365 is too strong, and the breakout attempt has failed, possibly triggering a further downtrend.
Entry - RM0.340 - RM0.350
Stop Loss - RM0.325
Target Price - RM0.365 - RM0.390
Source: Mercury Securities Research - 7 Jan 2025
Related Stocks
| Chart | Stock Name | Last | Change | Volume |
|---|


tksw
https://klse.i3investor.com/web/blog/detail/mercurysec/2025-01-07-story-h497729061-Hiap_Teck_5072_Ready_for_a_Triangle_Breakout
2nd time say triangle break out oreidi, but dunno why said only break upwards, no say possible break downward. 😁
3 hours ago