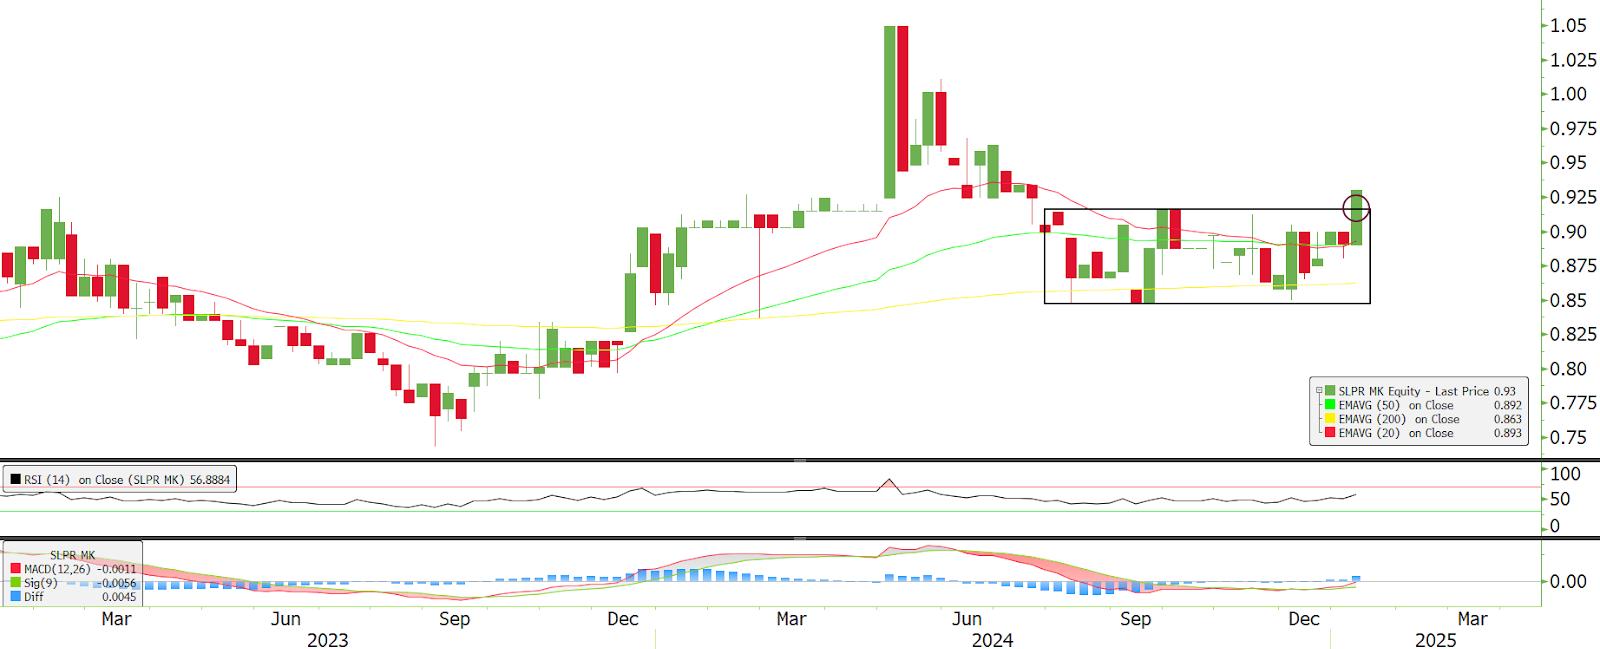
SLP Resources (7248) - Rectangle Break with EMA Support
MercurySec
Publish date: Wed, 08 Jan 2025, 08:35 AM

Technical Highlights
Since September 2023, the stock has been on an upward trend, reaching its 52-week high of RM1.09 in May 2024. However, after hitting that peak, the stock entered a downtrend, eventually creating a new 52-week low of RM0.85. For over five months, the stock traded sideways between RM0.85 and RM0.93, forming a rectangle consolidation pattern. This week, a breakout occurred, with the stock gaining 4.5% and closing above the upper boundary of this range. Adding to the bullish signal, the stock is now trading above all three key EMAs.
Momentum indicators also look promising. The RSI has climbed to 54, its highest level since June 2024, after spending six months in a neutral zone. Meanwhile, the MACD formed a golden cross in December, further supporting the case for a bullish breakout.
An ideal entry range for this stock would be between RM0.91 and RM0.93. The first resistance level to watch is RM0.95, and if that level is cleared, the next target would be around RM1.07, just shy of the 52-week high. On the downside, if the stock falls below RM0.89, it could signal that the breakout is not holding, potentially initiating a correction phase.
Entry - RM0.91 - RM0.93
Stop Loss - RM0.89
Target Price - RM0.95 - RM1.07
Source: Mercury Securities Research - 8 Jan 2025
Related Stocks
| Chart | Stock Name | Last | Change | Volume |
|---|


