


MQTrader Education Series
MQ Trader Strategy – Guppy MMA

MQTrader Jesse
Publish date: Thu, 26 Jul 2018, 11:15 AM
What is Guppy Multiple Moving Average (Guppy MMA)?
The Guppy Multiple Moving Average (Guppy MMA) is a technical indicator that is able to identify the changes in trends by combining two groups of simple moving averages (SMA) with different time periods.
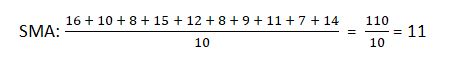
Calculation for simple moving average:
Simple moving average (SMA) is the mean number of a given set of values.
Table 1: The price of a stock throughout the past 10 days.
|
Day |
1 |
2 |
3 |
4 |
5 |
6 |
7 |
8 |
9 |
10 |
|
Price |
16 |
10 |
8 |
15 |
12 |
8 |
9 |
11 |
7 |
14 |
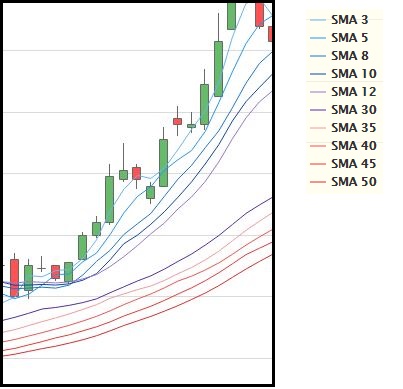
There are 2 sets of moving averages used in Guppy MMA:
- Short-term: The first set of moving averages has a relatively brief time frame for assessing short-term trading activity. The number of days that is commonly used is 3, 5,8,10 and 12.
- Long-term: The second set of moving averages is computed based on longer time period for analyzing long-term investor activity. The number of days that is usually used is 30, 35, 40, 45 and 50.
The relationship between both sets of moving averages allow traders to determine their relationship with each other by identifying if the short-term trading outlook aligns with the long-term investment outlook.
Source: MQ Trader Stock Analysis System
How to identify Buy and Sell signals with Guppy MMA?
|
Breakout |
Buy signal |
Sell signal |
|
|
a |
Crossover |
All of the short-term Guppy MMAs cross all of the long-term Guppy MMAs from bottom. |
All of the short-term Guppy MMAs cross all of the long-term Guppy MMAs from the top. |
|
b |
Trend Direction |
|
|
|
c |
Trend Reversal |
|
|
|
d |
Sharp Move Identification |
|
|
For a clearer image of the statement above, different types of breakout are demonstrated in the Figure (a) & (b), (c) and (d) as shown below by using Supermax Guppy MMA Hourly Chart.

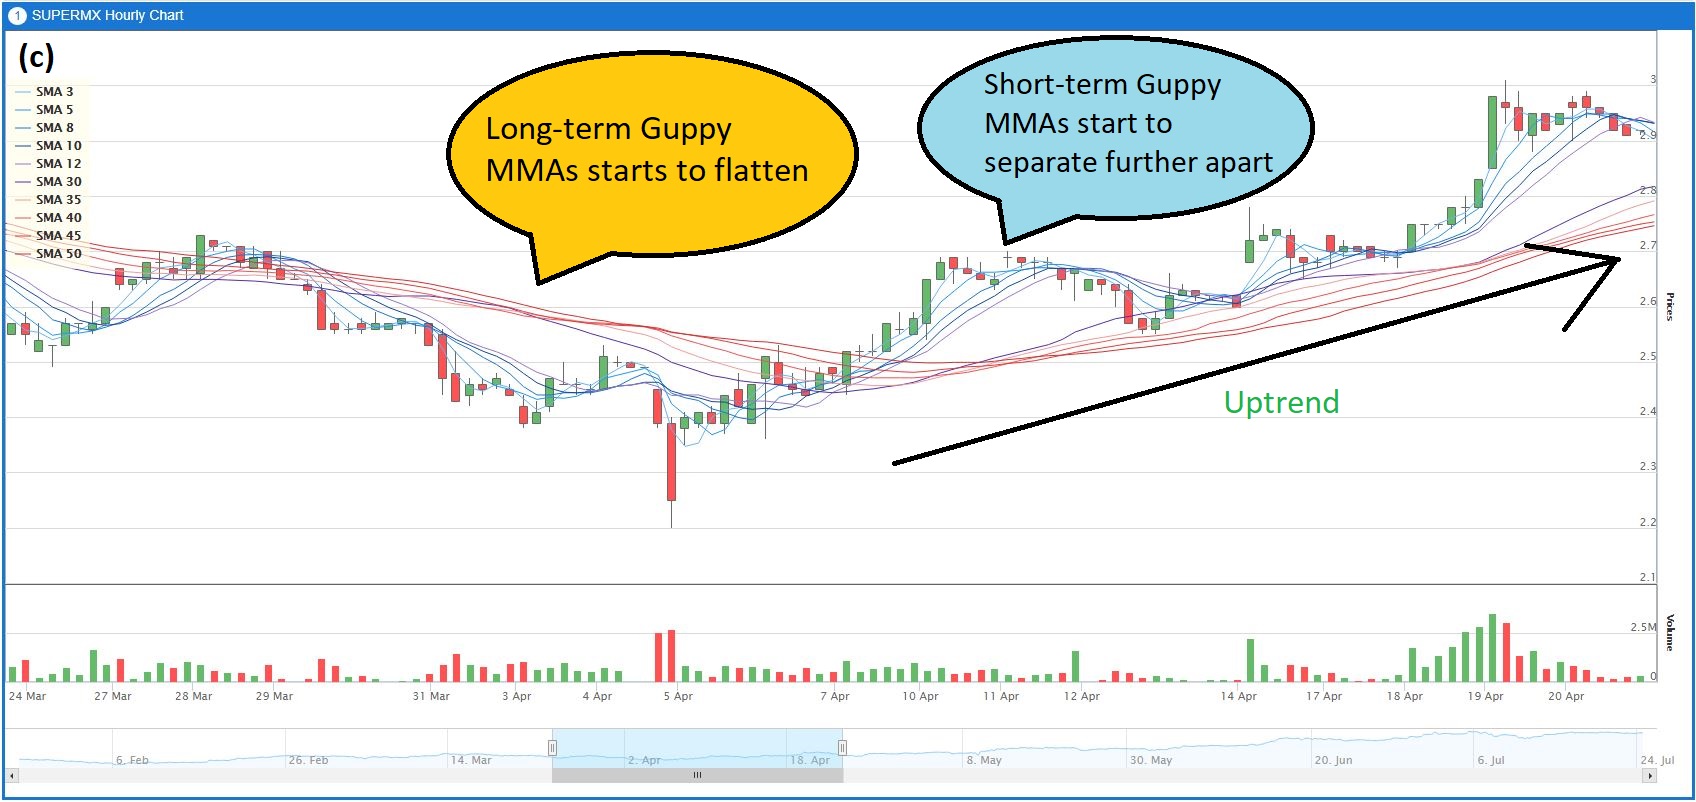

Figure 1: Guppy MMA hourly chart of (a) & (b) Crossover and trend direction demonstration, (c) Trend reversal demonstration and (d) Sharp move identification demonstration.
Advantages of Guppy MMA
- The GMMA indicators enable traders to have a better understanding on the trend strength
- Better analysis of trading activity and the trend environment can be determined
- Effective evaluation of abnormal price movements including dips and spikes
- Improves the selection of the proper trading strategies
Disadvantages of Guppy MMA
- Not applicable for trendless stocks
- Lagging effect
Conclusion
Guppy MMA trading strategy is a very useful tool to identify the trend strength of a stock. It can be used in conjunction with other technical indicators such as EMA 5 Crossover, MACD and RSI, ADX Crossover and Turtle Strategy to maximize their odds of success.
Community Feedback
We encourage traders to try out and evaluate the MQ Trader system and provide us feedback on the features you like to see in the system. We have received many positive feedbacks so far, and we are currently compiling and reviewing them for possible inclusion into the next release of the system.
We would like to develop this system based on community feedback to cater for community needs. Thanks to all those who have provided valuable feedback to us. Keep those feedbacks coming in!
Disclaimer
This article does not represent a BUY or SELL recommendation on the stock covered. Traders and Investors are encouraged to do their own analysis on stocks instead of blindly following any Trading calls raised by various parties in the Internet. We may or may not hold position in the stock covered, or initiate new position in the stock within the next 7 days.
Join us now!
MQ Trader stock analysis system uses Artificial Intelligence (AI), various technical indicators and quantitative data to generate accurate trading signals without the interference of human's emotions and bias against any particular stock. It comprises trading strategies which are very popular among fund managers for analysing stocks.
MQ Trader stock analysis system is SPONSORED for MQ Trader members. To use this amazing tool, you can sign up via MQ Trader Sign Up!
Contact us
Please do not hesitate to contact us if you have any enquiry:
Email: service@mqtrader.com
Related Stocks
| Chart | Stock Name | Last | Change | Volume |
|---|
More articles on MQTrader Education Series

Is there a safe haven to invest in a recessionary environment?
Created by MQTrader Jesse | Apr 13, 2023
MQ Trader - Why trade in a stock market that has strong currency?
Created by MQTrader Jesse | Aug 06, 2021
MQ Trader - How to validate buy signals by using MQ Live Backtesting? [ECOWLD]
Created by MQTrader Jesse | Nov 01, 2019
Featured Posts


Latest Videos


MQ Trading Signals
Time
Signal
Duration
Type
2025-01-17 15:55:00
EMA 5
5 Mins
SELL
2025-01-17 15:50:00
EMA 5
5 Mins
BUY
2025-01-17 14:50:00
EMA 5
5 Mins
SELL
2025-01-17 14:45:00
EMA 5
5 Mins
BUY
2025-01-17 14:40:00
EMA 5
5 Mins
SELL
Apps


Top Articles
1
RHB Investment Research Reports
2
Dragon Leong blog
3
4
5
Haha and Hehe
6
HLBank Research Highlights
7
8
Mercury Securities Research
#
Stock
Score
Daily Stocks
Stock Name
Last
Change
Volume
Stock Name
Last
Change
Volume
Stock Name
Last
Change
Volume
Featured Advertisers / Partners


Ride The Bull Short The Bear
CS Tan
4.9 / 5.0
This book is the result of the author's many years of experience and observation throughout his 26 years in the stockbroking industry. It was written for general public to learn to invest based on facts and not on fantasies or hearsay....
chengsk67
Good write up to intro Guppy MMA. Thanks! Hope to see more technical analysis cases on klse stocks.
2018-07-27 15:06