


MQTrader Education Series
MQ Trader – Technical Screener for Up-trending stocks

MQTrader Jesse
Publish date: Fri, 03 Aug 2018, 12:33 PM
What is Technical Screener?
Technical Screener is a stock scanner that can find profitable swing trading setups according to technical analysis and chart patterns. It uses various technical indicators and moving averages which are further explained in MQ Trader – Variables of Technical Stock Screener.
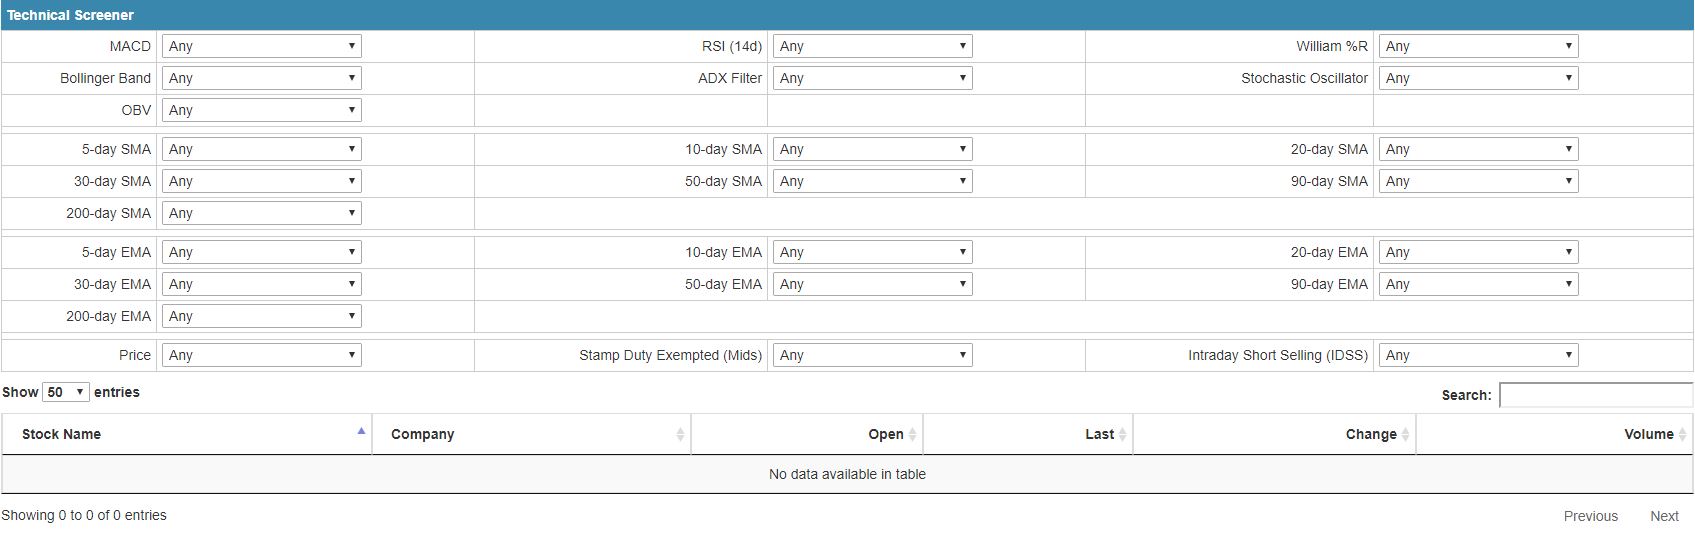
Source: MQ Trader Stock Analysis System
What to filter?
The setting of financial criteria is highly dependent on the type of trading or investing (i.e. day trading or swing trading) and it can be customized to obtain different results. Generally, shorter-term traders rely more on technical analysis which focuses mainly on the patterns of stock charts for forecasting future pricing and volume trends. Thus, purely technical screener is popular among shorter-term traders who put more emphasis on technical analysis.
There are plenty of combinations of variables can be used to filter the stocks accordingly. We would like to share some of the examples by using MQ Trader Technical Screener as below:
Up-trending Stocks
The variables set below is a combination of criteria based on MQ Trader strategies which can assist traders who would like to look for bullish/up-trending stocks.
|
Technical indicators |
|
|
Bollinger Band |
Price above Bollinger Band |
|
ADX Filter |
+DMI above –DMI & ADX above 25 (Strong Trend) |
|
OBV |
Above by 50% |
|
EMA |
|
|
5-day EMA |
EMA 5 above EMA 20 |
Then, we will be able to see the list of candidates that match all the criteria above as shown in the table below.
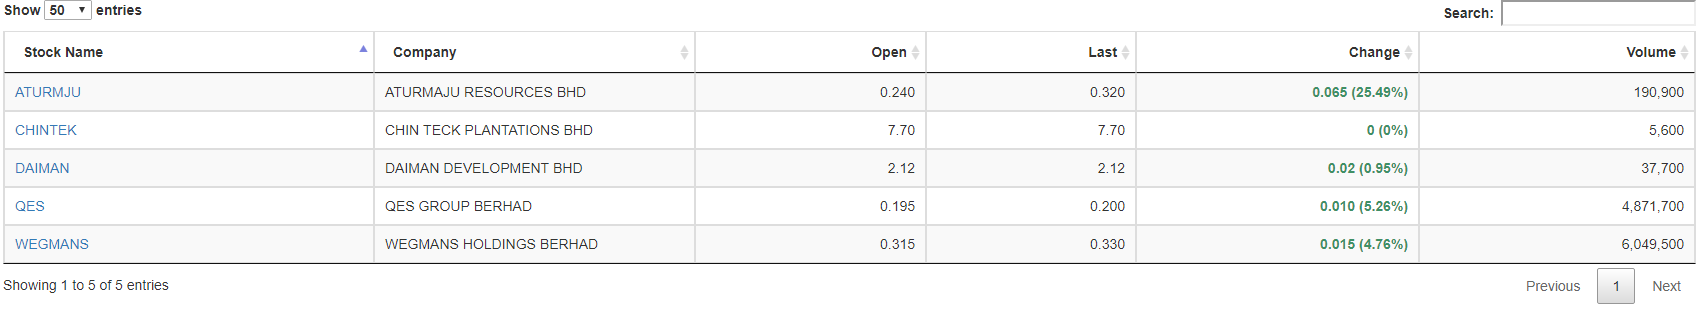
Table 1: Up-trending stocks list filtered on 2nd August 2018. (The stocks list varies from time to time based on the market sentiments.)
Screening the technical charts
Based on the stocks list we obtained, let’s go through a few stocks by using technical charts and MQ Trader Trading Strategies.
Figure 1(a) to 1(c) shows that 3 of the stocks are experiencing bullish price movement at the moment and their current chart patterns met all criteria that we set in the technical screener.
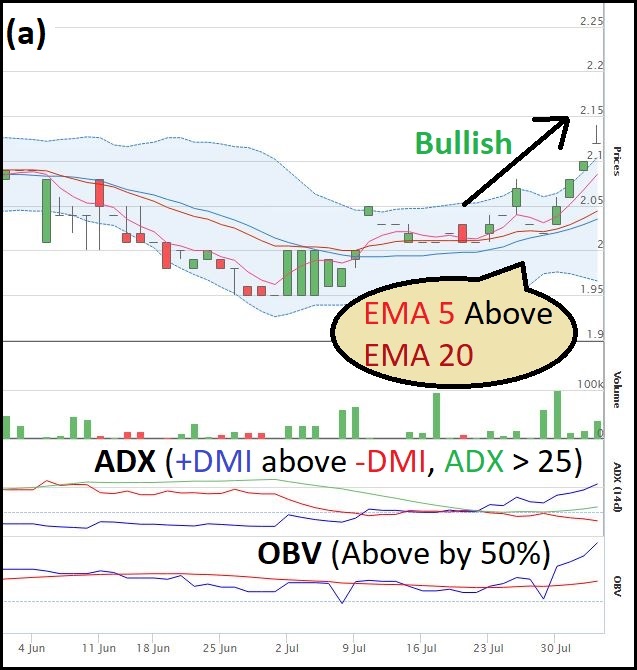
Figure 1(a): Daily technical chart of DAIMAN
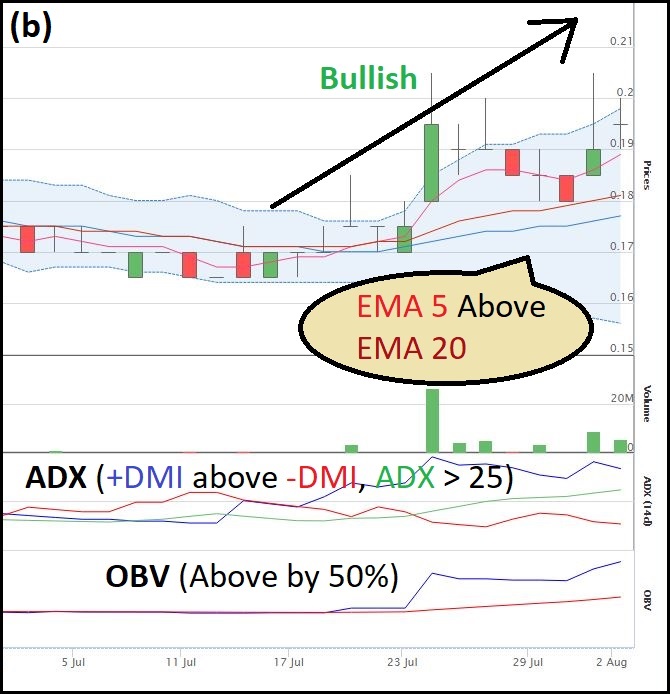
Figure 1(b): Daily technical chart of QES
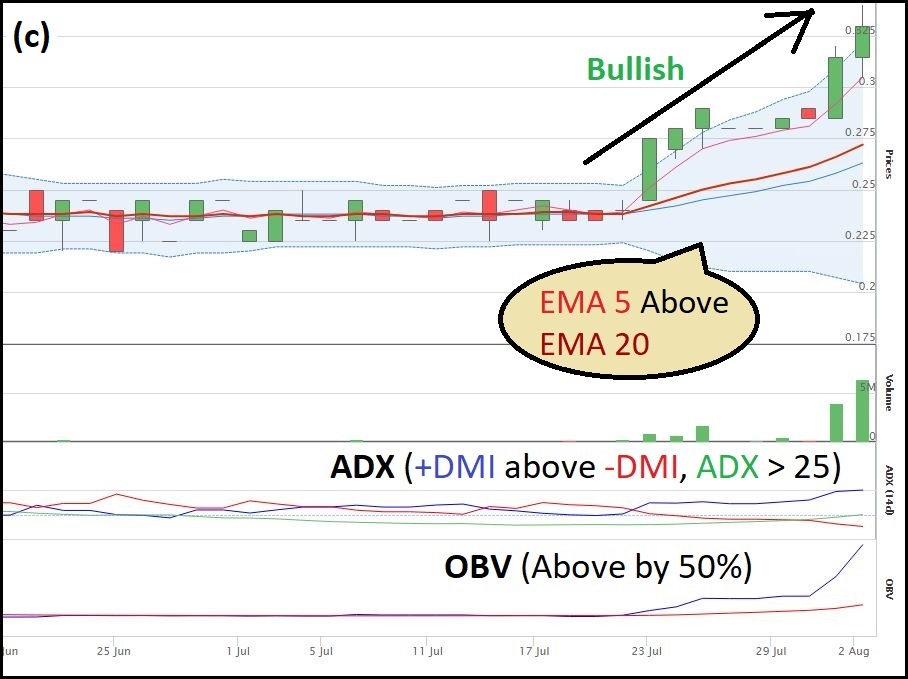
Figure 1(c): Daily technical chart of WEGMANS.
In the next stage, we will be choosing WEGMANS for demonstration on how to locate the buy signal in the technical chart.
Stay tuned to our next blogs if you are interested to know how to filter potential breakout stocks and down-trending stocks!
MQ Trader Trading Strategy
Investment does not always contribute profits if traders do not buy or sell the stocks at the right time. Thus, MQ Trader Trading Strategy plays an important role in this section to assist traders for knowing when to enter their position. To know more on MQ Trader trading strategy, kindly visit Introduction to MQ Trader Trading Strategies.
For trading stocks that are selected without considering their fundamental rating, we will apply “fast in fast out” rule to enter and exit our position within a short while. More sensitive charts such as hourly charts will be used instead of daily charts, as the trading signals have to be detected within a shorter time.
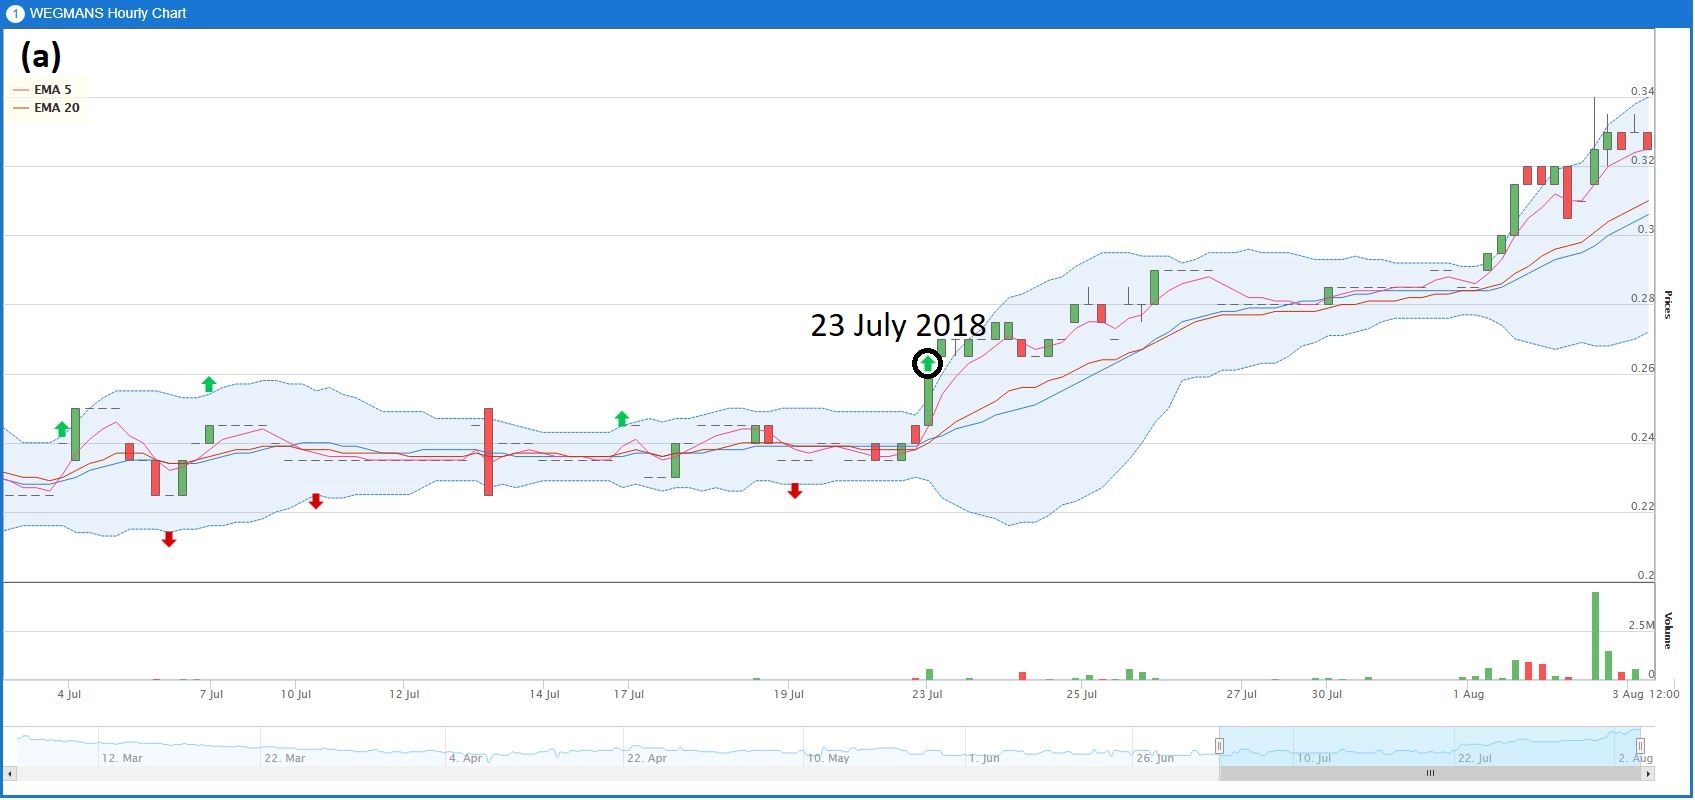
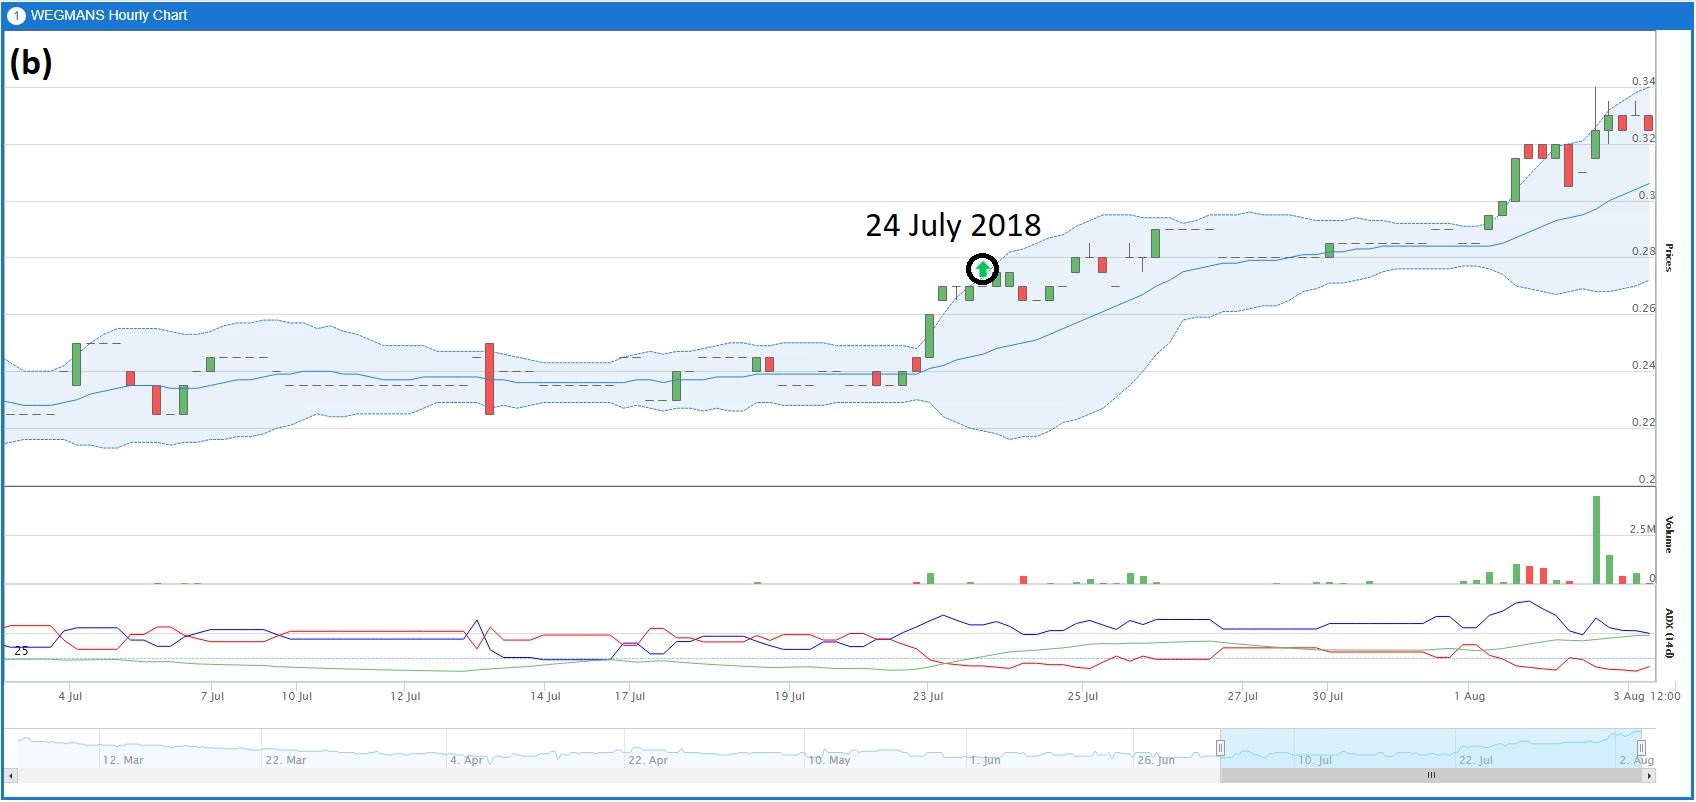
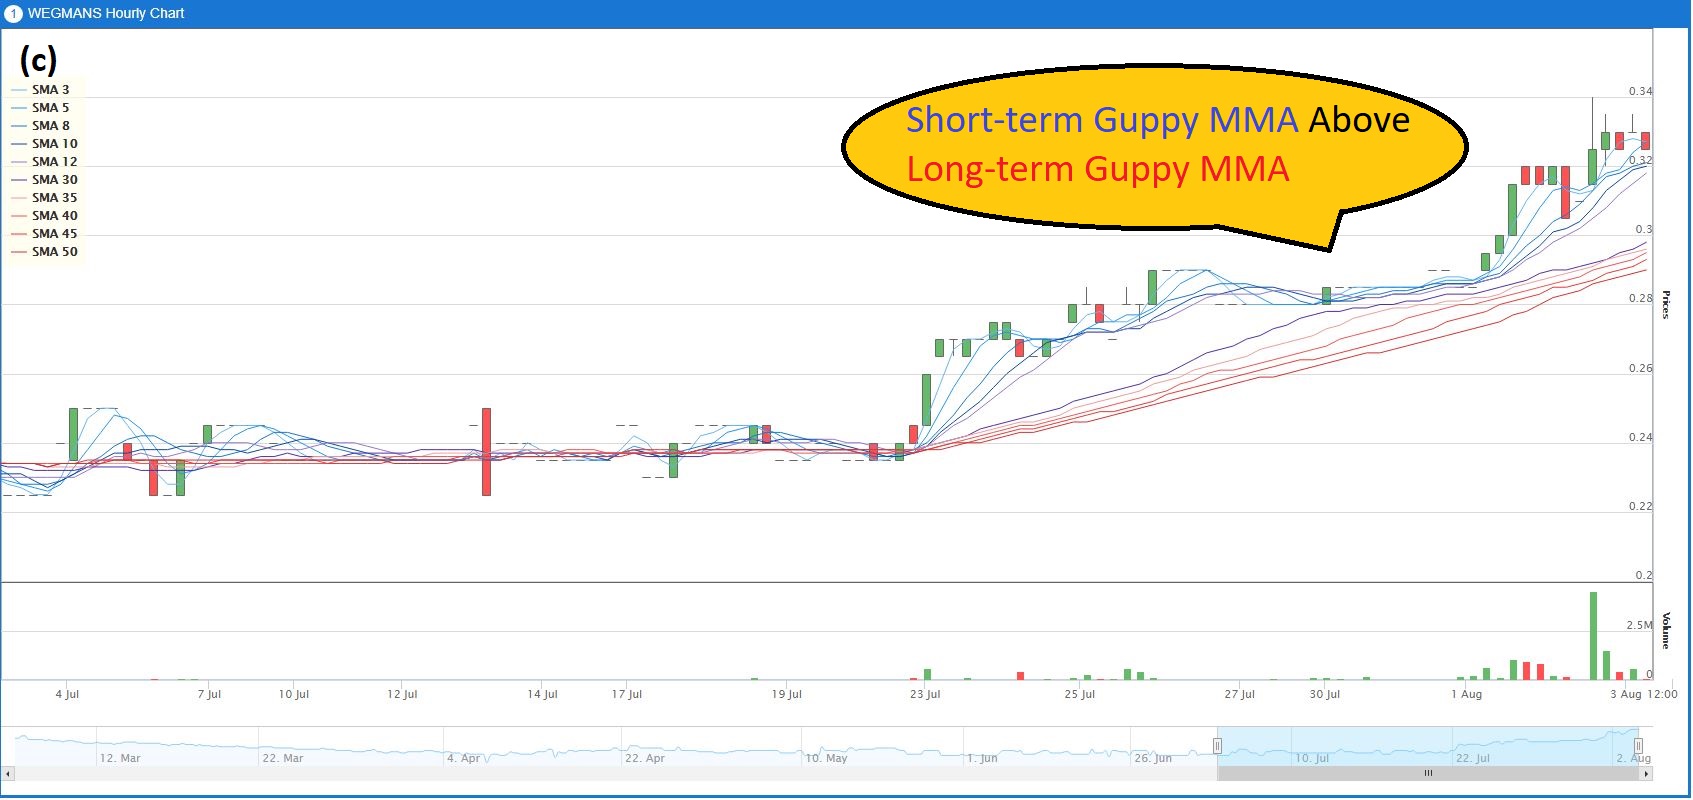
Figure 2: WEGMANS Hourly chart of (a) EMA 5 Crossover (b) ADX Crossover (c) Guppy MMA
EMA 5 Crossover and ADX Crossover confirmed that there was a buy signal appearing in the end of July2018 before the bullish trend takes place while Guppy MMA chart shows that the uptrend price movement is still ongoing at the moment. Hence, we can enter our position between 23 July 2018 to 24 July 2018 and exit from the position when the sell signal appears in the following days.
Conclusion
MQ Trader technical screener is able to filters stocks based on technical analysis purely when “fast in fast out” approach is used as our main trading strategy for earning profits in a short time. Other than technical analysis, the trading volume of a stock is also essential to ensure that the stock is actively traded before we enter our position. Besides, fundamental screener can be used to filter the stocks for longer-term investment which focuses more on a company’s fundamental analysis.
We will be explaining more about MQ Trader – Fundamental Screener and MQ Trader – Volume Screener in our next topics.
Community Feedback
We encourage traders to try out and evaluate the MQ Trader system and provide us feedback on the features you like to see in the system. We have received many positive feedbacks so far, and we are currently compiling and reviewing them for possible inclusion into the next release of the system.
We would like to develop this system based on community feedback to cater for community needs. Thanks to all those who have provided valuable feedback to us. Keep those feedbacks coming in!
Disclaimer
This article does not represent a BUY or SELL recommendation on the stock covered. Traders and Investors are encouraged to do their own analysis on stocks instead of blindly following any Trading calls raised by various parties in the Internet. We may or may not hold position in the stock covered, or initiate new position in the stock within the next 7 days.
Join us now!
MQ Trader stock analysis system uses Artificial Intelligence (AI), various technical indicators and quantitative data to generate accurate trading signals without the interference of human's emotions and bias against any particular stock. It comprises trading strategies which are very popular among fund managers for analysing stocks.
MQ Trader stock analysis system is SPONSORED for MQ Trader members. To use this amazing tool, you can sign up via MQ Trader Sign Up!
Contact us
Please do not hesitate to contact us if you have any enquiry:
Email: service@mqtrader.com
Related Stocks
| Chart | Stock Name | Last | Change | Volume |
|---|
More articles on MQTrader Education Series
Is there a safe haven to invest in a recessionary environment?
Created by MQTrader Jesse | Apr 13, 2023
MQ Trader - Why trade in a stock market that has strong currency?
Created by MQTrader Jesse | Aug 06, 2021
MQ Trader - How to validate buy signals by using MQ Live Backtesting? [ECOWLD]
Created by MQTrader Jesse | Nov 01, 2019
Featured Posts
Introducing MY's First IPO Fund for Sophisticated Investors!
New Update. Discover investment communities that resonate with your ideas
M & A Value Partners IPO Equity Fund has been launched - Targeted 13% Return p.a
Latest Videos


Apps


Top Articles
1
THE INVESTMENT APPROACH OF CALVIN TAN
2
Koon Yew Yin's Blog
3
save malaysia!
5
6
7
8
Mercury Securities Research
#
Stock
Score
Daily Stocks
Stock Name
Last
Change
Volume
Stock Name
Last
Change
Volume
Featured Advertisers / Partners


Ride The Bull Short The Bear
CS Tan
4.9 / 5.0
This book is the result of the author's many years of experience and observation throughout his 26 years in the stockbroking industry. It was written for general public to learn to invest based on facts and not on fantasies or hearsay....