


MQTrader Education Series
MQ Trader – Variables of Technical Screener

MQTrader Jesse
Publish date: Fri, 03 Aug 2018, 12:32 PM
Introduction
In this blog, we will be explaining in details on the function of each variable of MQ Trader Technical Screener. To read more about MQ Trader Technical Screener, please visit MQ Trader - Technical Screener for Up-trending Stocks.
Technical indicators
- MACD
Moving average convergence divergence (MACD) is a trend-following momentum indicator that shows the relationship between 2 moving averages of prices.
- RSI (14 days)
Relative Strength Index (RSI) is a momentum indicator that measures the magnitude of the recent price changes to analyze overbought or oversold conditions.
For reading more about MACD and RSI, please visit MQ Trader Strategy - MACD and RSI.
- William %R
William %R is a momentum indicator that reflects the level of the close relative to the highest high for the look-back period. William %R oscillates from 0 to -100. Readings from 0 to -20 are considered overbought. Readings from -80 to -100 are considered oversold.
- Bollinger Band
Bollinger Band, developed by famous technical trader John Bollinger, is plotted two standard deviations away from a simple moving average. The standard deviation is a measure of volatility, when the markets become more volatile, the bands widen; during less volatile periods, the bands contract.
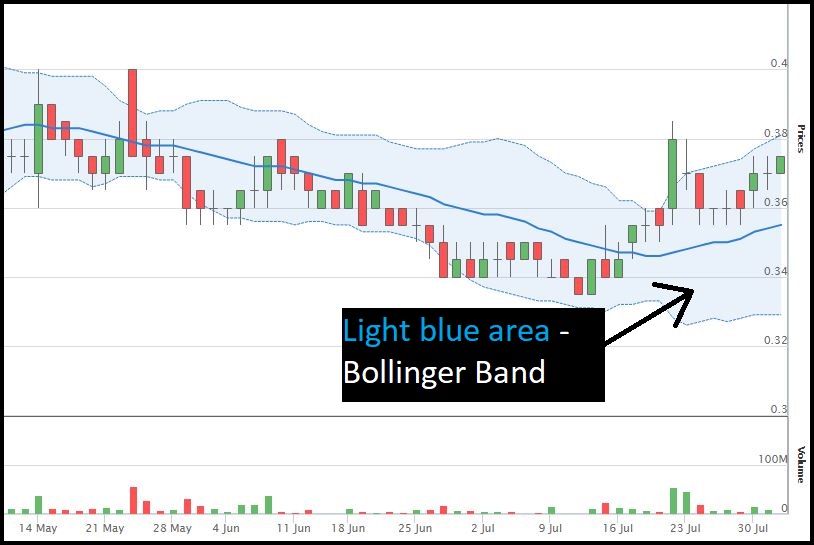
Source: MQ Trader Stock Analysis System
- ADX Filter
Average Directional Index (ADX) is used to quantify trend strength. Three lines including Average Directional Index (ADX), Minus Directional Indicator (-DI) and Plus Directional Indicator (+DI) are formed to determine both trend direction and trend strength.
- Stochastic Oscillator
The Stochastic Oscillator is a momentum indicator that shows the location of the close relative to the high-low range over a set number of periods. As a rule, the momentum changes direction before price. As such, bullish and bearish divergences in the Stochastic Oscillator can be used to foreshadow reversals. The oscillator ranges from zero to one hundred. Traditional settings use 80 as the overbought threshold and 20 as the oversold threshold.
Bullish: when the fast stochastic oscillator (Stoch %K) crosses above the slow stochastic oscillator (Stoch %D) and is in the oversold (below 20) treshold
Bearish: when Stoch %K crosses below Stoch %D and is in the overbought (above 80) threshold
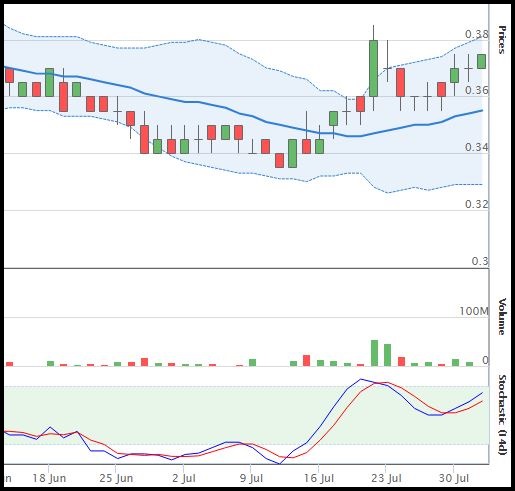
Source: MQ Trader Stock Analysis System
- OBV
On-balance volume (OBV) is a momentum indicator that uses volume flow to predict changes in stock price.
Simple moving average (SMA)
A simple moving average (SMA) is an arithmetic moving average calculated by adding recent closing prices and then dividing that by the number of time periods in the calculation average.
- 5-day SMA
- 10-day SMA
- 20-day SMA
- 30-day SMA
- 50-day SMA
- 90-day SMA
- 200-day SMA
The crossover of SMA of different number of days can be used as a technical indicator such as rising moving average and moving average crossover to identify bullish or bearish price movement of a share.
The rising moving average is one of the simplest technical indicators used in trading. The trend is bullish when the 10 day Moving Average is rising in the past 3 days; bearish when it is falling in the past 3 days, and neutral otherwise.
A moving-average crossover occurs when two moving averages each based on different degrees of smoothing cross. Such a crossover can be used to signal a change in trend. For our analysis, we look at 10 day SMA and 50 day SMA. The trend is bullish when the 10 day SMA is above the 50 day SMA, and bearish if 10 day SMA is below 50 day SMA.
Exponential Moving Average (EMA)
EMA is a type of moving average that places a greater weight and significance on the most recent data points. It reacts more significantly to recent price changes than a simple moving average, which applies an equal weight to all observations in the period.
- 5-day EMA
- 10-day EMA
- 20-day EMA
- 30-day EMA
- 50-day EMA
- 90-day EMA
- 200-day EMA
To understand more about trading strategy that involves EMA, kindly visit MQ Trader – EMA 5 Crossover.
Price
This variable enables traders to filter stocks with their desired price range.
Stamp Duty Exempted (Mids)
Stamp duty on shares of mid and small cap companies is waived for three (3) years from 1 March 2018 to 28 February 2022. For stamp duty exemption in 2018, eligible mid and small cap companies are those with market capitalisation between RM200 million and RM2 billion as at 31 December 2017.
Intraday Short Selling (IDSS)
This variable provides a list of stocks which are available for IDSS. To know more about IDSS, please read What is intraday short selling?
Community Feedback
We encourage traders to try out and evaluate the MQ Trader system and provide us feedback on the features you like to see in the system. We have received many positive feedbacks so far, and we are currently compiling and reviewing them for possible inclusion into the next release of the system.
We would like to develop this system based on community feedback to cater for community needs. Thanks to all those who have provided valuable feedback to us. Keep those feedbacks coming in!
Disclaimer
This article does not represent a BUY or SELL recommendation on the stock covered. Traders and Investors are encouraged to do their own analysis on stocks instead of blindly following any Trading calls raised by various parties in the Internet. We may or may not hold position in the stock covered, or initiate new position in the stock within the next 7 days.
Join us now!
MQ Trader stock analysis system uses Artificial Intelligence (AI), various technical indicators and quantitative data to generate accurate trading signals without the interference of human's emotions and bias against any particular stock. It comprises trading strategies which are very popular among fund managers for analysing stocks.
MQ Trader stock analysis system is SPONSORED for MQ Trader members. To use this amazing tool, you can sign up via MQ Trader Sign Up!
Contact us
Please do not hesitate to contact us if you have any enquiry:
Email: service@mqtrader.com
More articles on MQTrader Education Series

Is there a safe haven to invest in a recessionary environment?
Created by MQTrader Jesse | Apr 13, 2023
MQ Trader - Why trade in a stock market that has strong currency?
Created by MQTrader Jesse | Aug 06, 2021
MQ Trader - How to validate buy signals by using MQ Live Backtesting? [ECOWLD]
Created by MQTrader Jesse | Nov 01, 2019
Featured Posts


Latest Videos


Apps


Top Articles
1
THE INVESTMENT APPROACH OF CALVIN TAN
2
Koon Yew Yin's Blog
3
save malaysia!
5
6
7
8
Mercury Securities Research
#
Stock
Score
Daily Stocks
Stock Name
Last
Change
Volume
Stock Name
Last
Change
Volume
Stock Name
Last
Change
Volume
MQ Trading Signals
Stock
Time
Signal
Duration
Stock
Time
Signal
Duration
Featured Advertisers / Partners


Ride The Bull Short The Bear
CS Tan
4.9 / 5.0
This book is the result of the author's many years of experience and observation throughout his 26 years in the stockbroking industry. It was written for general public to learn to invest based on facts and not on fantasies or hearsay....