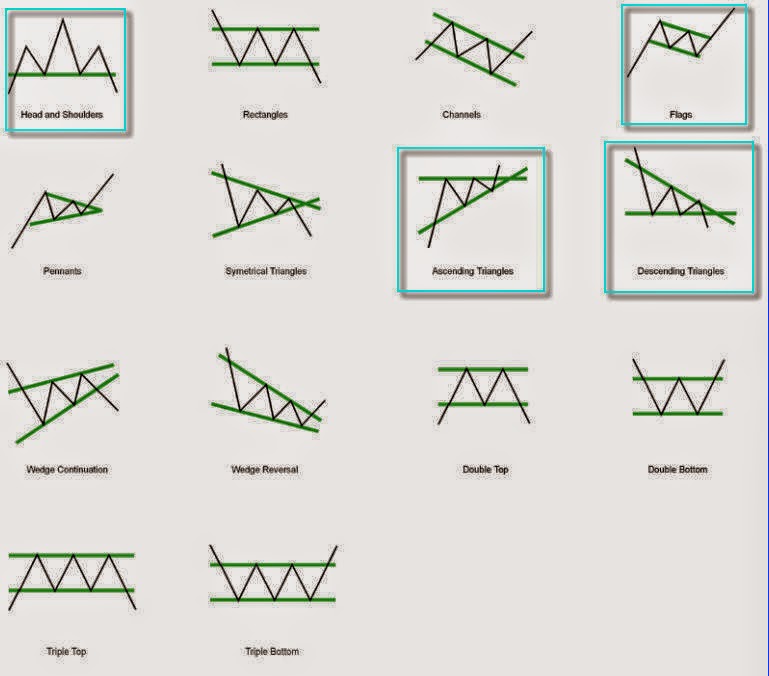
Stock chart patterns found in stocks are no different from a road signage. A signage or signboard will show the car driver whether he or she is going in the correct path to reach his or her destination. Stock chart patterns act like a signage for stocks. In the short-term, it will point the trader a direction as to where the stock is heading in relation to the share price.
Unfortunately, most newbies and amateurs traders do not care about looking at stock charts of every stock before making a purchase. Why this happens often is they are probably unaware how trading really works, basing their trading on Lady Luck! and good tips or often (the case) simply do not know how to analyse the chart of a stock.
11 Most Common Stock Chart Patterns.
1. Cup and Handle / Saucer and Handle
2. Flat Base
3. Ascending Triangle
4. Parabolic Curve
5. Wedge Formation
6. Channel Formation
7. Symmetrical Triangle
8. Descending Triangle
9. Flags and Pennants
10. Head and Shoulders
11. Inverted Head and Shoulders
(Source : www.ChartPattern.com)
How To Get A Stock Chart Patterns Education.
Many free and paid resources can be easily found on the subject such as -
1. Free online resources, type “stock chart patterns’ on Goggle.
2. Attend a paid seminar organised by an expert
3. Buy a good book on the subject
4. Learn from a friend
5. Subscribe to a newsletter
6. Join a stock investing club
7. Join as member in a stock market forum
8. Join a Facebook group on stock trading
Lastly, How To Be Successful In Stock Chart Patterns Trading.
To be successful in trading this, you will need to educate yourself on the stock chart patterns. Begin by familiarising yourself with the chart patterns so that you recognise them at once when you see a stock chart. Then learn the best entry points and the best exit points on the stock. Finally you will need a stock scanner to find the stocks that exhibit the stock chart patterns you are looking for. Don’t be too concerned as there are various online resources you can utilise to find what you want there.
Conclusion
Most professional players consider stock chart patterns as an integral part to their trading success in the stock market. If you are not using stock chart patterns in your stock trading today, you are at a major disadvantage to the professional players and you are exposing yourself to major losses in the stock market. And IF you are wondering why you keep losing money in the stock market, not fully understanding the stock chart patterns could be the one good reason for your past stock market losses.


