Rakuten Trade Research Reports
Technical View - Kerjaya Prospek Group Bhd (KERJAYA, 7161)
rakutentrade
Publish date: Mon, 06 Sep 2021, 03:11 PM

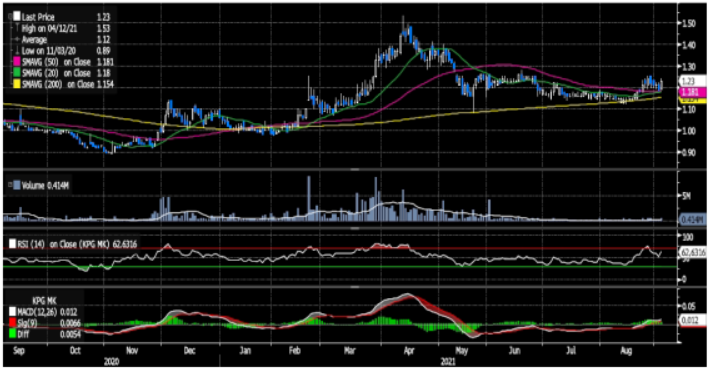
• KERJAYA closed 3.36% higher at RM1.23 last Friday.
• KERJAYA has formed a bullish engulfing last Friday and managed to stay above all its key moving average (MA). As the MA 20 has started to cross above the MA 50, there is a high possibility for the stock to trend higher. There was also uptick in RSI and bullish signal shown in MACD indicator.
• Hence, resistance levels are identified at RM1.25 (R1) and RM1.33 (R2).
• On the contrary, support levels are pegged at RM1.19 (S1) and RM1.15 (S2).
Source: Rakuten Research - 6 Sept 2021
Related Stocks
| Chart | Stock Name | Last | Change | Volume |
|---|
More articles on Rakuten Trade Research Reports
Discussions
Be the first to like this. Showing 0 of 0 comments


