RHB Investment Research Reports
Trading Stocks - CEKD
rhbinvest
Publish date: Wed, 28 Feb 2024, 09:59 AM

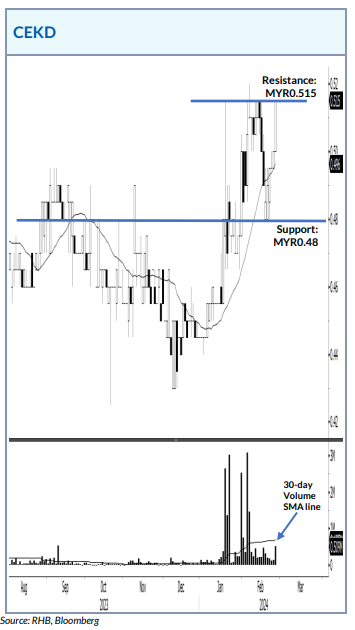
CEKD is poised to trend higher after bouncing off the 21-day SMA line in an attempt to break past the MYR0.515 immediate resistance level. If it manages to surpass this level, the bullish bias may propel the stock higher towards the MYR0.55 resistance level, followed by the next one at MYR0.62. However, a fall below the MYR0.48 support level would kick off a downtrend.
Source: RHB Securities Research - 28 Feb 2024
Related Stocks
| Chart | Stock Name | Last | Change | Volume |
|---|
More articles on RHB Investment Research Reports
Malaysian Resources Corp - Expanding TOD Footprint In The Silver State; Still BUY
Created by rhbinvest | Jan 24, 2025
Discussions
Be the first to like this. Showing 0 of 0 comments


