RHB Investment Research Reports
Trading Stocks - Hibiscus Petroleum
rhbinvest
Publish date: Tue, 06 Aug 2024, 09:38 AM

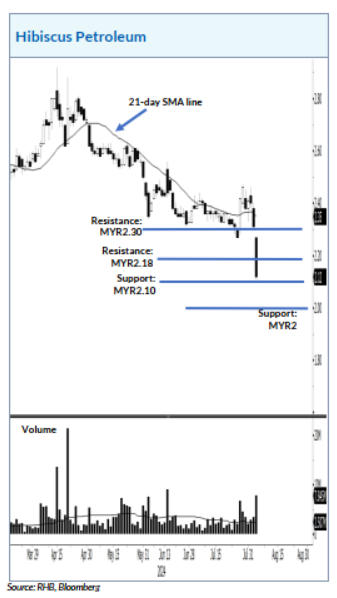
Hibiscus Petroleum may see a technical breakout, after hitting a multi-month low. The counter has been moving on “lower low” patterns since it fell below the 21-day SMA line. If it dips below the MYR2.10 support level, the counter may extend its correction towards the MYR2 level. On the upside, if the stock climbs above the MYR2.18 resistance, it could see a technical rebound towards the MYR2.30 resistance level.
Source: RHB Securities Research - 6 Aug 2024
Related Stocks
| Chart | Stock Name | Last | Change | Volume |
|---|
More articles on RHB Investment Research Reports
Coastal Contracts - Closing Off The Year In a Strong Cash Position; BUY
Created by rhbinvest | Dec 18, 2024
Discussions
Be the first to like this. Showing 0 of 0 comments


