RHB Investment Research Reports
Trading Stocks - Sime Darby
rhbinvest
Publish date: Wed, 09 Oct 2024, 10:10 AM

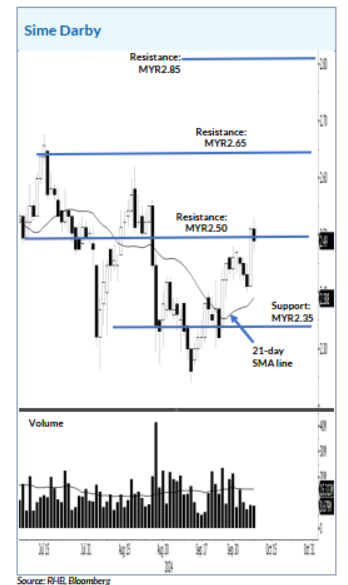
Sime Darby is looking to resume upside movement, as the stock has climbed above the resistance level. We observed that the 21- day SMA line is pointing upwards, showing that the short-term trend is bullish. If the counter stays above the MYR2.50 breakout point, it may continue to move higher to test the MYR2.65 level, followed by the MYR2.85 resistance level. However, if it falls below the MYR2.35 support level, it will kick of the bearish phase.
Source: RHB Securities Research - 9 Oct 2024
Related Stocks
| Chart | Stock Name | Last | Change | Volume |
|---|
More articles on RHB Investment Research Reports
Integrated Oil & Gas- The Long-Awaited PAO 2025-2027; OVERWEIGHT
Created by rhbinvest | Jan 31, 2025
Discussions
Be the first to like this. Showing 0 of 0 comments


