FBM Small Cap Index - View Still Positive
rhboskres
Publish date: Mon, 04 Jun 2018, 09:42 AM

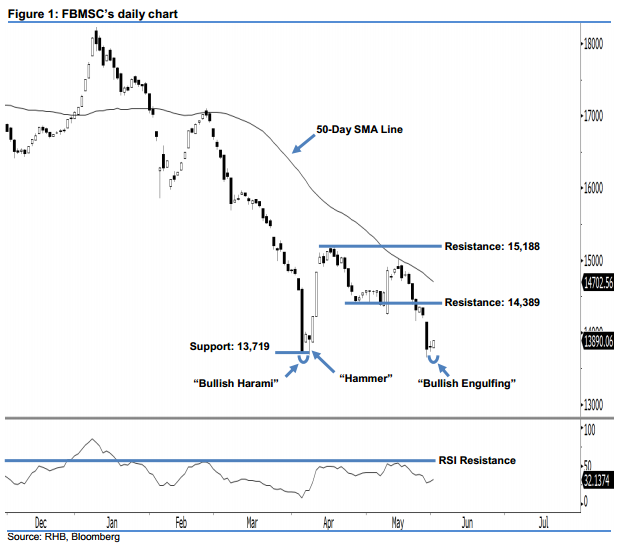
Our positive view remains in play, as the bulls are still dominating above the 13,719-pt mark. The FBMSC ended at 13,890.06 pts last Friday and posted an 89.37-pt increase. It formed a reversal “Bullish Engulfing” candlestick pattern that implied that the downside movement over the last two weeks had neared its limit. Presently, we believe the bullish bias is still exerting itself above the 13,719-pt support. As long as the index does not drop below this level, this implies that the bulls are still dominating market sentiment. Overall, there is no change to our positive view.
Based on the daily chart, we initially believed the FBMSC had already hit bottom at around 13,719 pts. This was supported by the appearance of two significant bullish reversal signals at the index’s 2-year low, ie 5 Apr’s “Bullish Harami” and 6 Apr’s “Hammer” patterns.
The immediate support is maintained at 13,719 pts, which was derived from the low of 5 Apr’s “Bullish Harami” pattern. This is followed by the next support at the 13,116-pt threshold, or the low of 25 Aug 2015. On the flip side, our immediate resistance is at 14,389 pts – this was the low of 26 Apr’s “Bullish Harami” pattern. For the next resistance, look to 15,188 pts, which is located at 17 Apr’s high.
Source: RHB Securities Research - 4 Jun 2018
More articles on RHB Retail Research
Created by rhboskres | Aug 26, 2024


