FTSE Singapore Straits Times Index - Strong Bearish Bias
rhboskres
Publish date: Mon, 18 Jun 2018, 11:00 AM

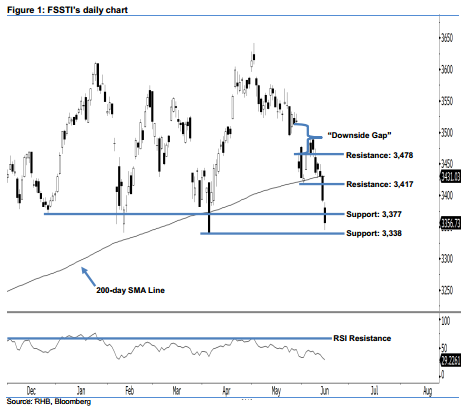
Bearish view continues as the correction was extended. Last Thursday, as the FSSTI dropped 35.78 pts to close at 3,356.73 pts. It charted a black candle after oscillating between a low of 3,345.18 pts and high of 3,388.88 pts. Based on the immediate view, the bears are strong and chances are high that the correction may still be extended further. The fact that the index is now situated firmly below the 200-day SMA line points towards a weak outlook. This enhances our downside view.
We initially saw a high potential that the correction could still be extended further since the appearance of the “Downside Gap” pattern last month – which represents a continuation signal of the correction. Overall, we believe that the current bearish bias is still exerting itself.
Our immediate support is maintained at 3,377 pts, obtained from the low of 7 Dec 2017. The following support is set at the 3,338-pt mark, which was the low of 4 Apr. Towards the upside, the immediate resistance is at 3,417 pts, or the low of 1 Jun. If this level is taken out, the next resistance is at the 3,478-pt threshold, located at 31 May’s high.
Source: RHB Securities Research - 18 Jun 2018
More articles on RHB Retail Research
Created by rhboskres | Aug 26, 2024


