FBM Small Cap Index - Bullish View Extends
rhboskres
Publish date: Tue, 10 Jul 2018, 10:05 AM

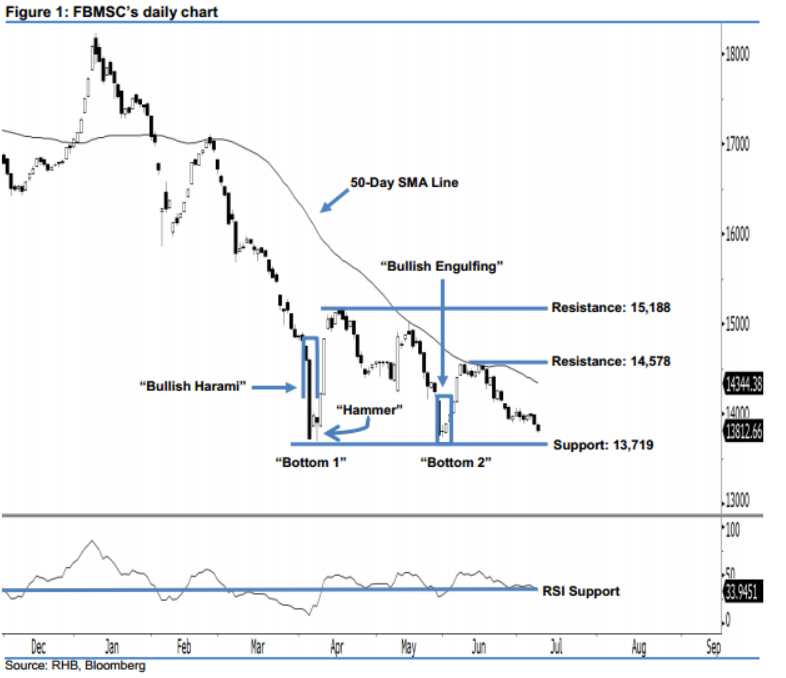
Positive view continues, as the index is still hovering above the 13,719-pt bullish territory. On Monday, the FBMSC inched down 78.65 pts to 13,812.66 pts. A black candle was formed after it oscillated between a low of 13,788.31 pts and high of 13,893.19 pts, which implies that the session was led by the bears. Nevertheless, as long as the index is able to hold above the 13,719-pt mark, this indicates that the bullish bias that started since early April is still intact. Overall, we make no change to our positive view.
Based on the daily chart above, we believe that the bulls are still in control of market sentiment. The two meaningful 2-year low reversal signals ie 5 Apr and 6 Apr’s “Bullish Harami” and “Hammer” patterns are still valid. In addition, the “Double Bottom” trend reversal pattern is still intact. All these positive indicators enhance our 3- month bullish view.
Presently, the immediate support stays at 13,719 pts, which is located at the low of 5 Apr’s “Bullish Harami” pattern. If this level is taken out, the following support is found at 13,116 pts, ie the low of 25 Aug 2015. On the flip side, we set the immediate resistance at 14,578 pts, or the high of 14 Jun. For the next resistance, look to 15,188 pts, ie 17 Apr’s high.
Source: RHB Securities Research - 10 Jul 2018
More articles on RHB Retail Research
Created by rhboskres | Aug 26, 2024


