FTSE Singapore Straits Times Index - May Still Climb
rhboskres
Publish date: Thu, 26 Jul 2018, 09:39 AM

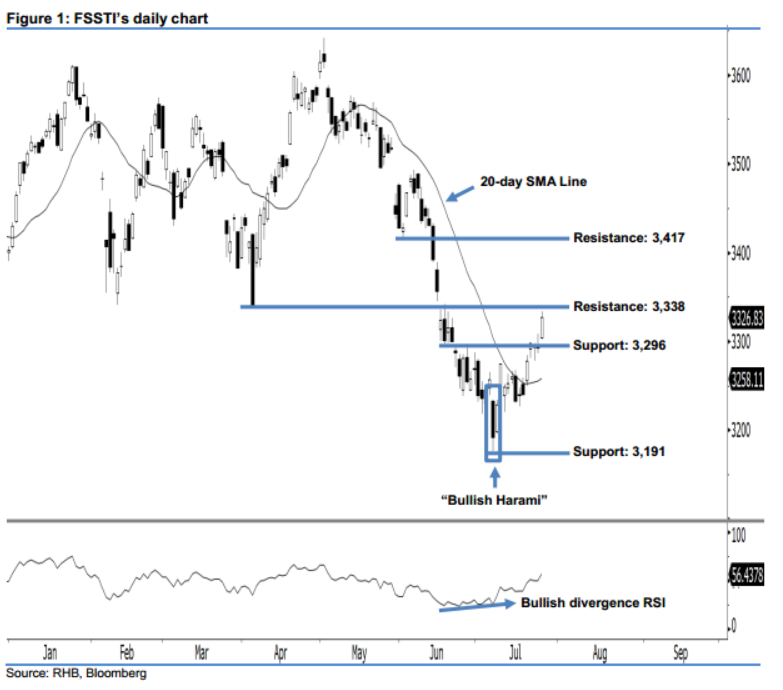
Bullish indicators support our positive view. Yesterday, the FSSTI charted a bullish session, as it rebounded by 34.18 pts to close at 3,326.83 pts. It left a white candle above the previous 3,296-pt resistance mark, after oscillating between a low of 3,301.85 pts and high of 3,333.38 pts. Presently, the bullish bias we detected in the “Bullish Harami” candlestick pattern on 9 Jul continues to exert itself. Based on the immediate momentum, chances are high for the index to inch higher.
The daily chart above shows that the FSSTI is now hovering steadily above the 20-day SMA line, which points to a positive outlook. In addition, we also highlight a reversal “Bullish Divergence” pattern – which indicates a potential turnaround to the upside. Technically speaking, all these positive indicators support our upside view.
The 3,296-pt mark, ie 27 Jun’s high, is maintained as our immediate support. The following support is pegged at the 3,191-pt threshold, located at the low of 9 Jul’s “Bullish Harami” pattern. On the flip side, we keep the immediate resistance at 3,338 pts, the low of 4 Apr. This is followed by the 3,417-pt resistance, or the low of 1 Jun.
Source: RHB Securities Research - 26 Jul 2018
More articles on RHB Retail Research
Created by rhboskres | Aug 26, 2024


