FBM Small Cap Index - Pointing North
rhboskres
Publish date: Mon, 06 Aug 2018, 09:34 AM

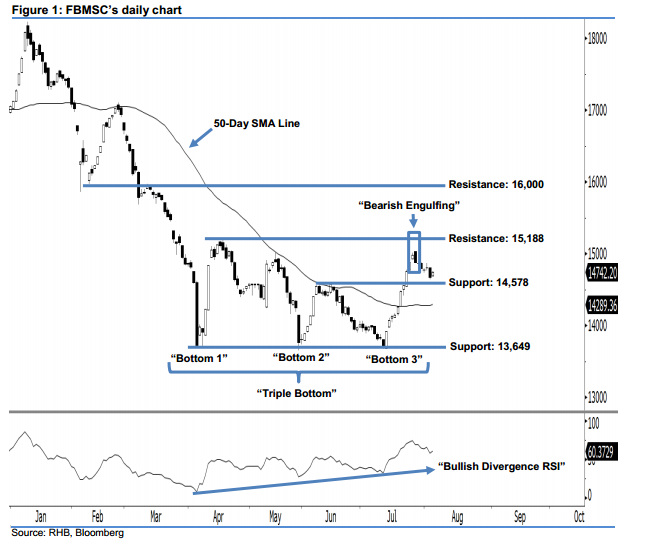
Our 4-month positive view remains in play. Last Friday was a bullish session for the FBMSC, as it rebounded by 69.46 pts to 14,742.20 pts. It charted a white candle after oscillating between a low of 14,677.26 pts and high of 14,750.44 pts. Although we saw a reversal “Bearish Harami” candlestick pattern on 26 Jul, no strong bearish follow-through was sighted. This implies that the bears are still unable to wrest control from the bulls. Overall, the bulls continue to dominate market sentiment.
The fact that the index is hovering steadily above the 50-day SMA line points towards a positive outlook. We highlight a meaningful “Triple Bottom” pattern and also the “Bullish Divergence RSI” pattern last month. These positive indicators suggest that the trend is now heading north, thereby enhancing our near 4-month positive view.
Our immediate support is maintained at 14,578 pts, which was the high of 14 Jun. This is followed by the next support at 13,649 pts, or the low of 30 May. Towards the upside, we set the immediate resistance at 15,188 pts, which is located at the high of 17 Apr. This is followed by the next resistance at the 16,000-pt threshold, ie near the low and high of 9 Feb and 12 Mar.
Source: RHB Securities Research - 6 Aug 2018
More articles on RHB Retail Research
Created by rhboskres | Aug 26, 2024


