Hang Seng Index Futures - Bearish Outlook Remains Intact
rhboskres
Publish date: Fri, 04 Jan 2019, 05:17 PM

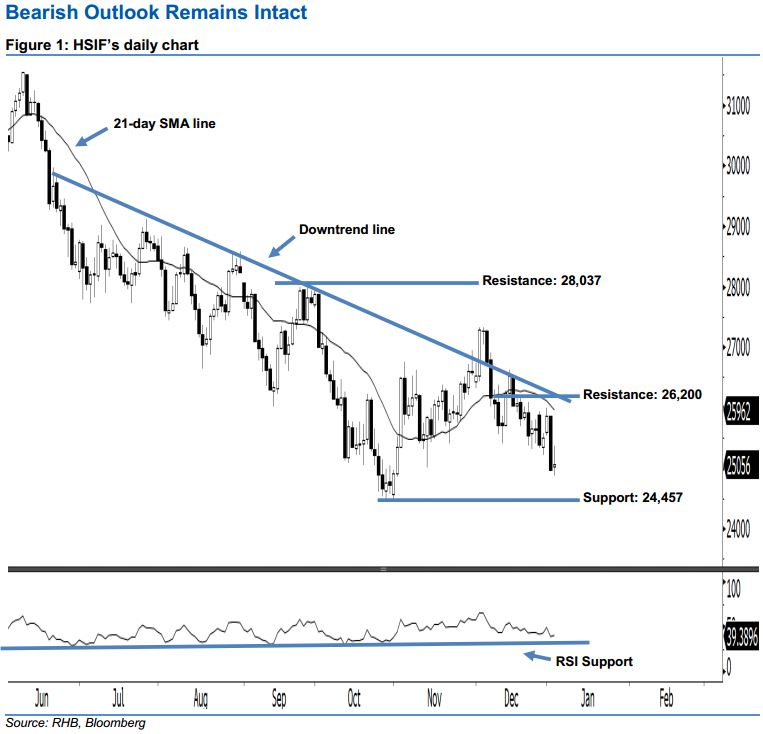
Stay short. Following the long black candle that formed on 2 Jan, the HSIF ended higher yesterday to form a “Doji” candle. It settled at 25,056 pts after hovering between a high of 25,363 pts and low of 24,876 pts. Still, yesterday’s candle merely indicated that sellers may be taking a pause after the recent losses. Technically, we note that the index is still trading below the 21-day SMA and downtrend lines drawn in the chart, which suggests the bearish sentiment remains unchanged. Overall, we expect the market to drop further if the immediate 24,457- pt support is taken out decisively in the coming sessions.
As seen in the chart, we eye the immediate resistance at 26,200 pts. This is set near the aforementioned downtrend line. If a breakout occurs, look to 28,037 pts – the high of 26 Sep 2018 – as the next resistance. Towards the downside, the immediate support is seen at 24,457 pts, which was the previous low of 29 Oct 2018. Meanwhile, the next support is anticipated at the 24,000-pt psychological mark.
As a result, we advise traders to stay short, following our recommendation of initiating short below the 25,940-pt level on 28 Dec 2018. In the meantime, a stop-loss can be set above the downtrend line at the 26,200-pt threshold to minimise the risk per trade.
Source: RHB Securities Research - 4 Jan 2019
More articles on RHB Retail Research
Created by rhboskres | Aug 26, 2024


