Hang Seng Index Futures - Maintain Short Positions
rhboskres
Publish date: Mon, 07 Jan 2019, 10:33 AM

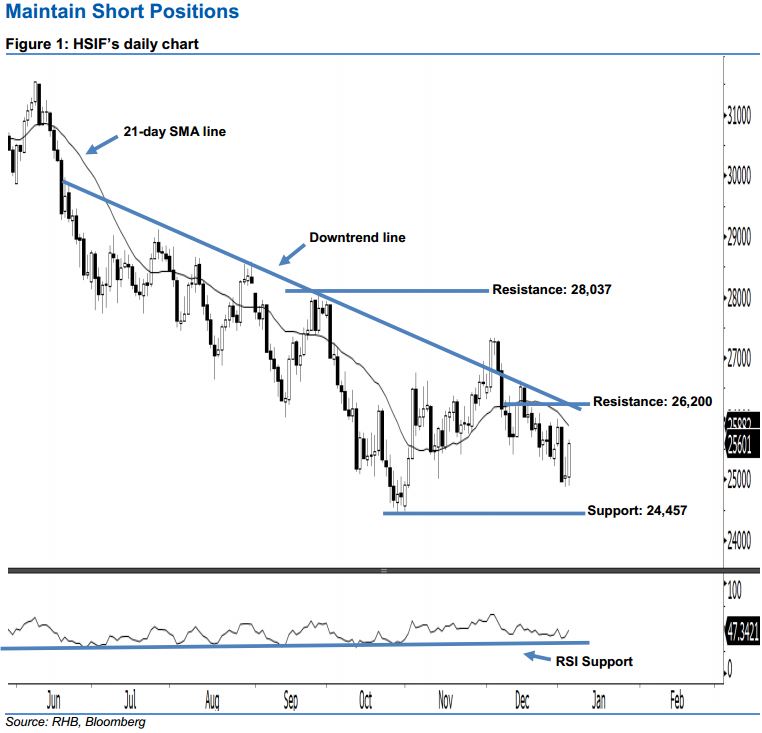
Stay short while setting a stop-loss above the downtrend line. The HSIF formed a white candle last Friday. During the intraday session, it rose to a high of 25,659 pts before ending at 25,601 pts for the day. Technically speaking, last Friday’s white candle should be viewed as a technical rebound following recent losses seen over the last two weeks. We think the bears may continue to control the market as long as the HSIF does not break above the downtrend line drawn in the chart – which comprises multiple highs of 26 Jul 2018, 30 Aug 2018 and 26 Sep 2018. Overall, we remain negative in our outlook.
Based on the daily chart, the immediate resistance is seen at 26,200 pts, ie near the downtrend line above. The next resistance would likely be at 28,037 pts, which was the high of 26 Sep 2018. To the downside, we anticipate the immediate support at 24,457 pts, obtained from the previous low of 29 Oct 2018. The next support is maintained at the 24,000-pt psychological spot.
Thus, we advise traders to maintain short positions, given that we initially recommended initiating short below the 25,940-pt level on 28 Dec 2018. A stop-loss can be set above the downtrend line at the 26,200-pt threshold in order to limit the risk per trade.
Source: RHB Securities Research - 7 Jan 2019
More articles on RHB Retail Research
Created by rhboskres | Aug 26, 2024


