RHB Retail Research
Trading Stocks - GDB
rhboskres
Publish date: Wed, 16 Jan 2019, 09:37 AM

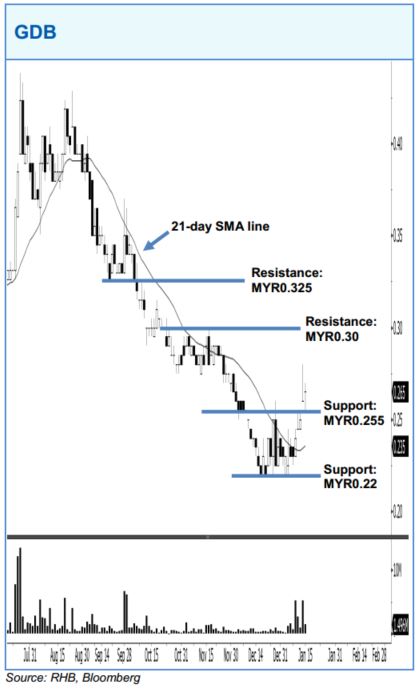
GDB’s upside move may continue after it recently rose above the 21-day SMA line. As the stock marked a higher close vis- à-vis the previous sessions since 9 Jan, this indicates a positive sign. A bullish bias may emerge above the MYR0.255 level, with an exit set below the MYR0.22 threshold. Towards the upside, the immediate resistance is at MYR0.30. This is followed by the MYR0.325 level.
Source: RHB Securities Research - 16 Jan 2019
Related Stocks
| Chart | Stock Name | Last | Change | Volume |
|---|
More articles on RHB Retail Research
Duopharma Biotech - Lacking Near-Term Re-Rating Catalysts; D/G NEUTRAL
Created by rhboskres | Aug 26, 2024
Discussions
Be the first to like this. Showing 0 of 0 comments


