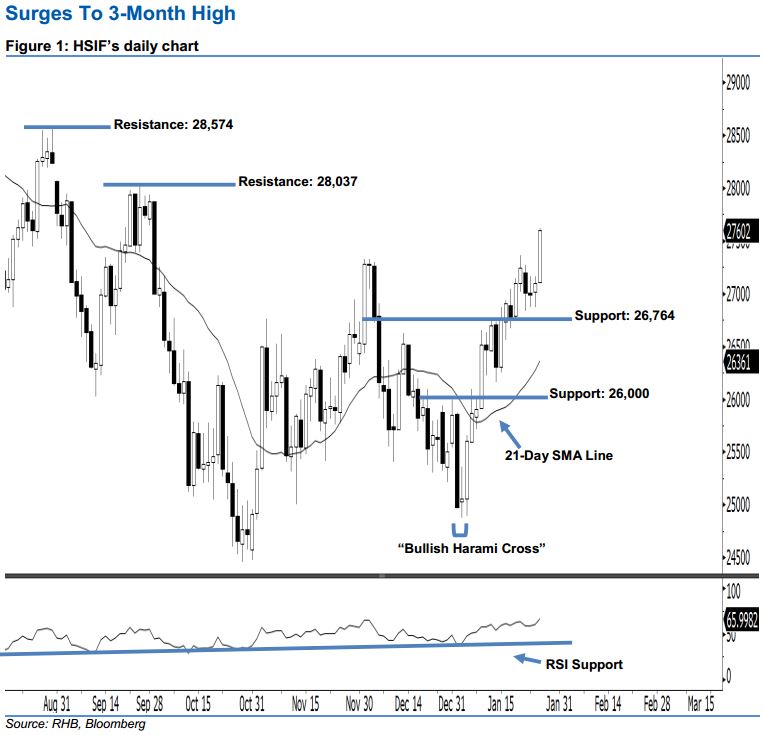
Hang Seng Index Futures - Surges to 3-Month High
rhboskres
Publish date: Mon, 28 Jan 2019, 11:23 AM

Stay long while setting a new trailing-stop below the 26,764-pt level. The HSIF formed a long white candle last Friday – indicating that the buying momentum could be strong. It surged 506 pts to close at 27,602 pts, off its high of 27,618 pts and low of 27,104 pts. Based on the current outlook, last Friday’s long white candle has taken out the previously-indicated 27,329-pt resistance. It has also sent the index to its highest point in more than three months, which indicates the buying momentum has extended. Overall, we think the rebound that started off 3 Jan’s “Bullish Harami Cross” pattern may continue.
According to the daily chart, we now anticipate the immediate support at 26,764 pts. This was obtained from the low of 18 Jan. The next support is seen at the 26,000-pt psychological spot. Conversely, the immediate resistance is set at 28,037 pts, or the previous high of 26 Sep 2018. Meanwhile, the next resistance is anticipated at 28,574 pts, which was the high of 30 Aug 2018.
To recap, on 10 Jan we initially recommended traders to initiate long positions above the 26,000-pt level. We continue to advise them to stay long for now while setting a new trailing-stop below the 26,764-pt threshold. This is in order to lock in a larger part of the profits.
Source: RHB Securities Research - 28 Jan 2019
More articles on RHB Retail Research
Created by rhboskres | Aug 26, 2024


