RHB Retail Research
Trading Stocks - Techbond Group
rhboskres
Publish date: Tue, 12 Feb 2019, 09:25 AM

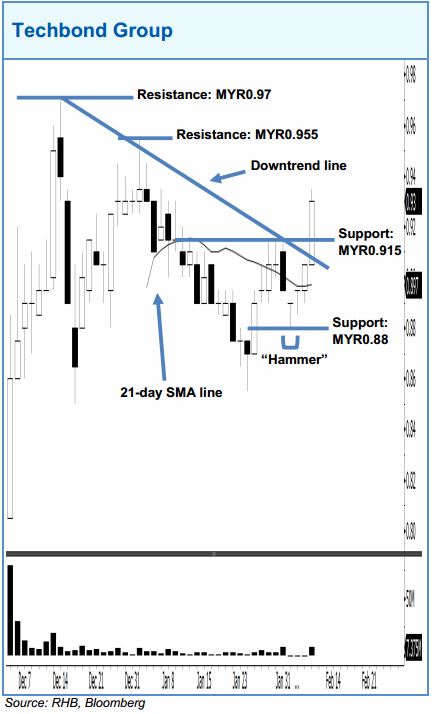
Techbond Group may rise higher after it breached above the downtrend line drawn in the chart. This candle can be viewed as a continuation of the bulls extending the rebound from 4 Feb’s “Hammer” pattern. A bullish bias may emerge above the MYR0.915 level, with an exit set below the MYR0.88 threshold. Towards the upside, the immediate resistance is at MYR0.955. This is followed by the MYR0.97 level.
Source: RHB Securities Research - 12 Feb 2019
Related Stocks
| Chart | Stock Name | Last | Change | Volume |
|---|
More articles on RHB Retail Research
Duopharma Biotech - Lacking Near-Term Re-Rating Catalysts; D/G NEUTRAL
Created by rhboskres | Aug 26, 2024
Discussions
Be the first to like this. Showing 0 of 0 comments


