Trading Stocks - MISC
rhboskres
Publish date: Thu, 27 Feb 2020, 05:27 PM

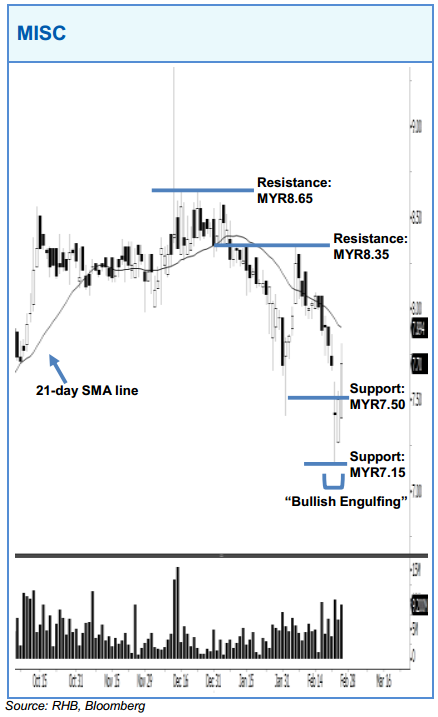
MISC may move higher after it formed a second consecutive white candle. As the stock has formed a “Bullish Engulfing” pattern on 25 Feb, this indicates a potential rebound. A positive bias may emerge above the MYR7.50 level, with an exit set below the MYR7.15 mark. Towards the upside, the immediate resistance is at the MYR8.35 level, followed by the MYR8.65 threshold.
Source: RHB Securities Research - 27 Feb 2020
Related Stocks
| Chart | Stock Name | Last | Change | Volume |
|---|
Market Buzz
2024-11-22
MISC2024-11-22
MISC2024-11-22
MISC2024-11-21
MISC2024-11-21
MISC2024-11-21
MISC2024-11-20
MISC2024-11-20
MISC2024-11-20
MISC2024-11-20
MISC2024-11-19
MISC2024-11-19
MISC2024-11-18
MISC2024-11-18
MISC2024-11-18
MISC2024-11-15
MISC2024-11-15
MISC2024-11-15
MISC2024-11-15
MISC2024-11-15
MISC2024-11-15
MISC2024-11-15
MISC2024-11-15
MISC2024-11-14
MISC2024-11-14
MISC2024-11-14
MISC2024-11-14
MISC2024-11-14
MISC2024-11-14
MISC2024-11-13
MISC2024-11-13
MISC2024-11-13
MISC2024-11-12
MISC2024-11-12
MISC2024-11-12
MISC2024-11-12
MISCMore articles on RHB Retail Research
Created by rhboskres | Aug 26, 2024


