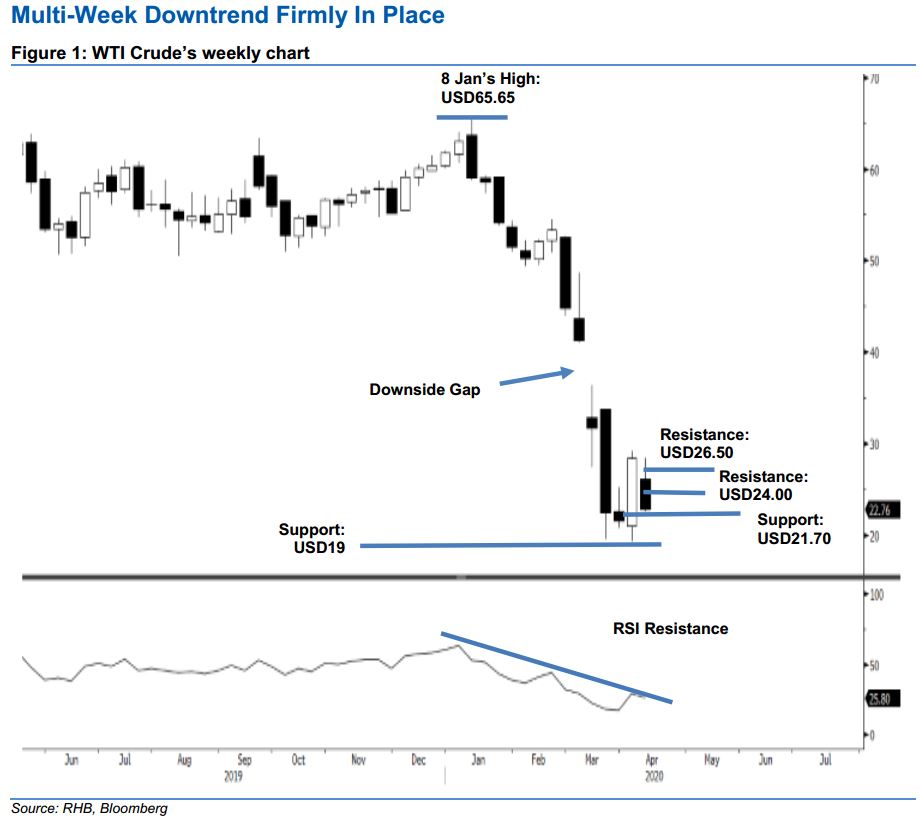
WTI Crude Futures - Multi-Week Downtrend Firmly in Place
rhboskres
Publish date: Mon, 13 Apr 2020, 09:50 AM

Multi-week retracement leg not showing signs of ending. Today, we take a look at the WTI crude’s weekly chart. The WTI crude experienced a sharp multi-week retracement phase after it reached a high of USD65.65 on 8 Jan. This retracement has only managed to stabilise after it came in near to test the USD19.00 support level multiple times between mid-March and early April. While the commodity has been showing signs of staging a rebound over the past week or so, this rebound is still relatively mild vs the said multi-week sharp retracement and does not indicate a change in trend. Additionally, the RSI is still unable to cross above the resistance line – as drawn in the chart. Maintain our negative trading bias.
Until there are clearer price signals to indicate a stronger rebound is taking place, we continue to suggest traders stay in short positions. These were initiated at USD23.63, the closing level of 7 Apr. To manage the risk, a stoploss can be placed at the USD26.50 mark.
The immediate support is pegged at USD21.70, followed by USD19.00. Moving up, the immediate resistance is set at USD24.00, followed by USD26.50 – both are derived from 9 Apr’s candle.
Source: RHB Securities Research - 13 Apr 2020
More articles on RHB Retail Research
Created by rhboskres | Aug 26, 2024


