RHB Retail Research
Trading Stocks - Axiata Group
rhboskres
Publish date: Tue, 15 Jun 2021, 11:48 AM

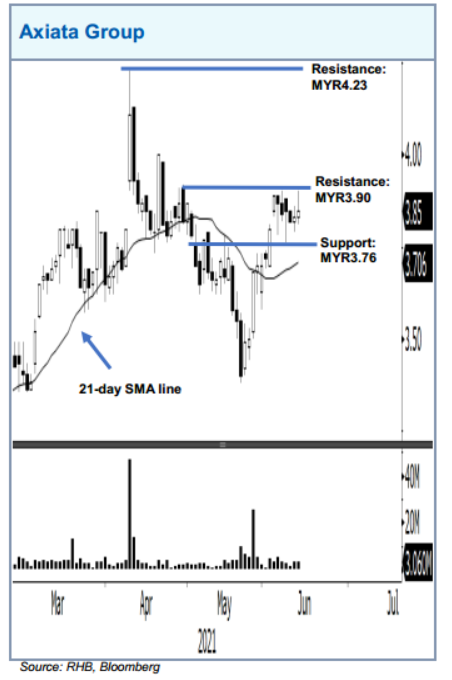
Axiata Group is attempting to stage a technical breakout after testing the immediate resistance marked at MYR3.90. If it manages to surpass the resistance, a “higher high” price pattern would appear – indicating strong positive momentum. It may then climb towards the next resistance of MYR4.23, followed by MYR4.30. Meanwhile, falling below the MYR3.76 support level, may see the stock reverse direction to a downtrend.
Source: RHB Securities Research - 15 Jun 2021
Related Stocks
| Chart | Stock Name | Last | Change | Volume |
|---|
More articles on RHB Retail Research
Duopharma Biotech - Lacking Near-Term Re-Rating Catalysts; D/G NEUTRAL
Created by rhboskres | Aug 26, 2024
Discussions
Be the first to like this. Showing 0 of 0 comments


