


info sharing with newbie
Moving Average Convergence Divergence - MACD

The MACD indicator is an effective and versatile tool. Besides signaling buy/sell indicators, the MACD can also be used to sound out potential change in trading direction for stocks and futures. There are three main components of the MACD:
- MACD: This line is plotted based on the difference between the 12-day and 26-day exponential moving averages (EMA)
- MACD Signal Line: This is a 9-day EMA of the MACD
- MACD Histogram: Each bar of the histogram represents the difference between the MACD and the MACD Signal Line
How to interpret MACD buy/sell signals?
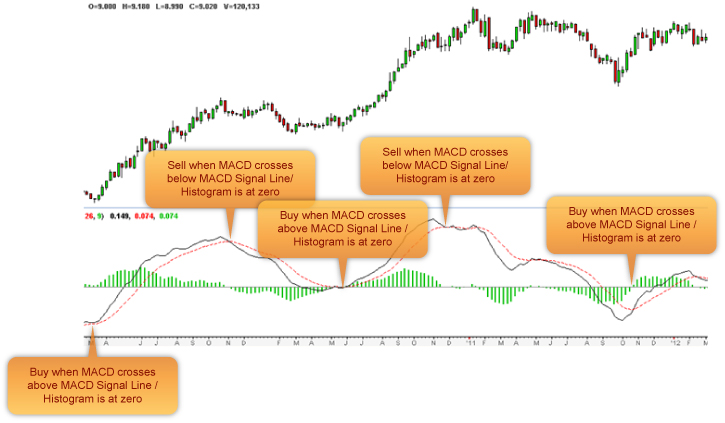
Reading the signals is simple and straightforward. At the point of the MACD crossing over the MACD Signal Line, a trading buy/sell signal is given. This is further confirmed by the MACD Histogram.
MACD Crossover signal :
- Buy: This is signaled by the MACD crossing above the MACD Signal
- Sell: This is signaled by the MACD crossing below the MACD Signal
- The buy/sell signals are also confirmed by the MACD Histogram.
MACD Histogram
As mentioned earlier, MACD Histogram is the difference between the EMAs. Each bar represents the difference between the two moving averages on that date. The interpretation of the MACD Histogram is as follows:
At zero: The two moving averages have the same numerical value – they have zero difference between them.
Bar grows taller: Divergence is growing as difference increases. This indicates that the trend will continue.
Bar shrinks: The two moving averages are converging, watch out for a signal change.
Buy: When the MACD histogram is below the zero line and begins to converge towards the zero line. The point of convergence coincides with the MACD crossing over the MACD Signal and indicates the buying point.
Sell: When the MACD histogram is above the zero line and begins to converge towards the zero line. The point of convergence coincides with the MACD crossing below the MACD Signal and indicates the selling point.
The forecasting ability of the MACD indicator makes it a popular choice among technicians. However, as always one must use the indicator in conjunction with another to confirm buy/sell decisions. At all times, it is not advisable to use one indicator in isolation.
More articles on info sharing with newbie
Featured Posts
Introducing MY's First IPO Fund for Sophisticated Investors!
New Update. Discover investment communities that resonate with your ideas
M & A Value Partners IPO Equity Fund has been launched - Targeted 13% Return p.a
Latest Videos


Apps


Top Articles
1
2
Kenanga Research & Investment
YTL Power International - 1-for-5 Warrants to Reward Shareholders
3
Double Swords 双剑论股
4
Double Swords 双剑论股
5
Rakuten Trade Research Reports
6
M+ Online Research Articles
7
MQ Market Updates
8
TA Sector Research
#
Stock
Score
Daily Stocks
Stock Name
Last
Change
Volume
Stock Name
Last
Change
Volume
Stock Name
Last
Change
Volume
MQ Trading Signals
Stock
Time
Signal
Duration
Stock
Time
Signal
Duration
Featured Advertisers / Partners


Ride The Bull Short The Bear
CS Tan
4.9 / 5.0
This book is the result of the author's many years of experience and observation throughout his 26 years in the stockbroking industry. It was written for general public to learn to invest based on facts and not on fantasies or hearsay....