


SGDMYR
SGDMYR : Major Bear On The Way

Triple Reversal Breakdown. This is one of the most reliable chart pattern and take many years to form. Once breakdown on the neckline, will take many years to complete.
The Triple Top Reversal is a bearish reversal pattern typically found on bar charts, line charts and candlestick charts. There are three equal highs followed by a break below support. As major reversal patterns, these patterns usually form over a 3 to 6 month period. Note that a Triple Top Reversal on a bar or line chart is completely different from Triple Top Breakout on a P&F chart.. Namely, Triple Top Breakouts on P&F charts are bullish patterns that mark an upside resistance breakout. We will first examine the individual parts of the pattern and then look at an example.
 Triple Top Reversal example chart from StockCharts.com")
-
Prior Trend: With any reversal pattern, there should be an existing trend to reverse. In the case of the Triple Top Reversal, an uptrend should precede the formation.
-
Three Highs: All three highs should be reasonably equal, well spaced and mark clear turning points to establish resistance. The highs do not have to be exactly equal, but should be reasonably equivalent to each other.
-
Volume: As the Triple Top Reversal develops, overall volume levels usually decline. Volume sometimes increases near the highs. After the third high, an expansion of volume on the subsequent decline and at the support break greatly reinforces the soundness of the pattern.
-
Support Break: As with many other reversal patterns, the Triple Top Reversal is not complete until a support break. The lowest point of the formation, which would be the lowest of the intermittent lows, marks this key support level.
-
Support Turns Resistance: Broken support becomes potential resistance, and there is sometimes a test of this newfound resistance level with a subsequent reaction rally.
-
Price Target: The distance from the support break to the highs can be measured and subtracted from the support break for a price target. The longer the pattern develops, the more significant the ultimate break. Triple Top Reversals that are 6 or more months old represent major tops and a price target is less likely to be effective.
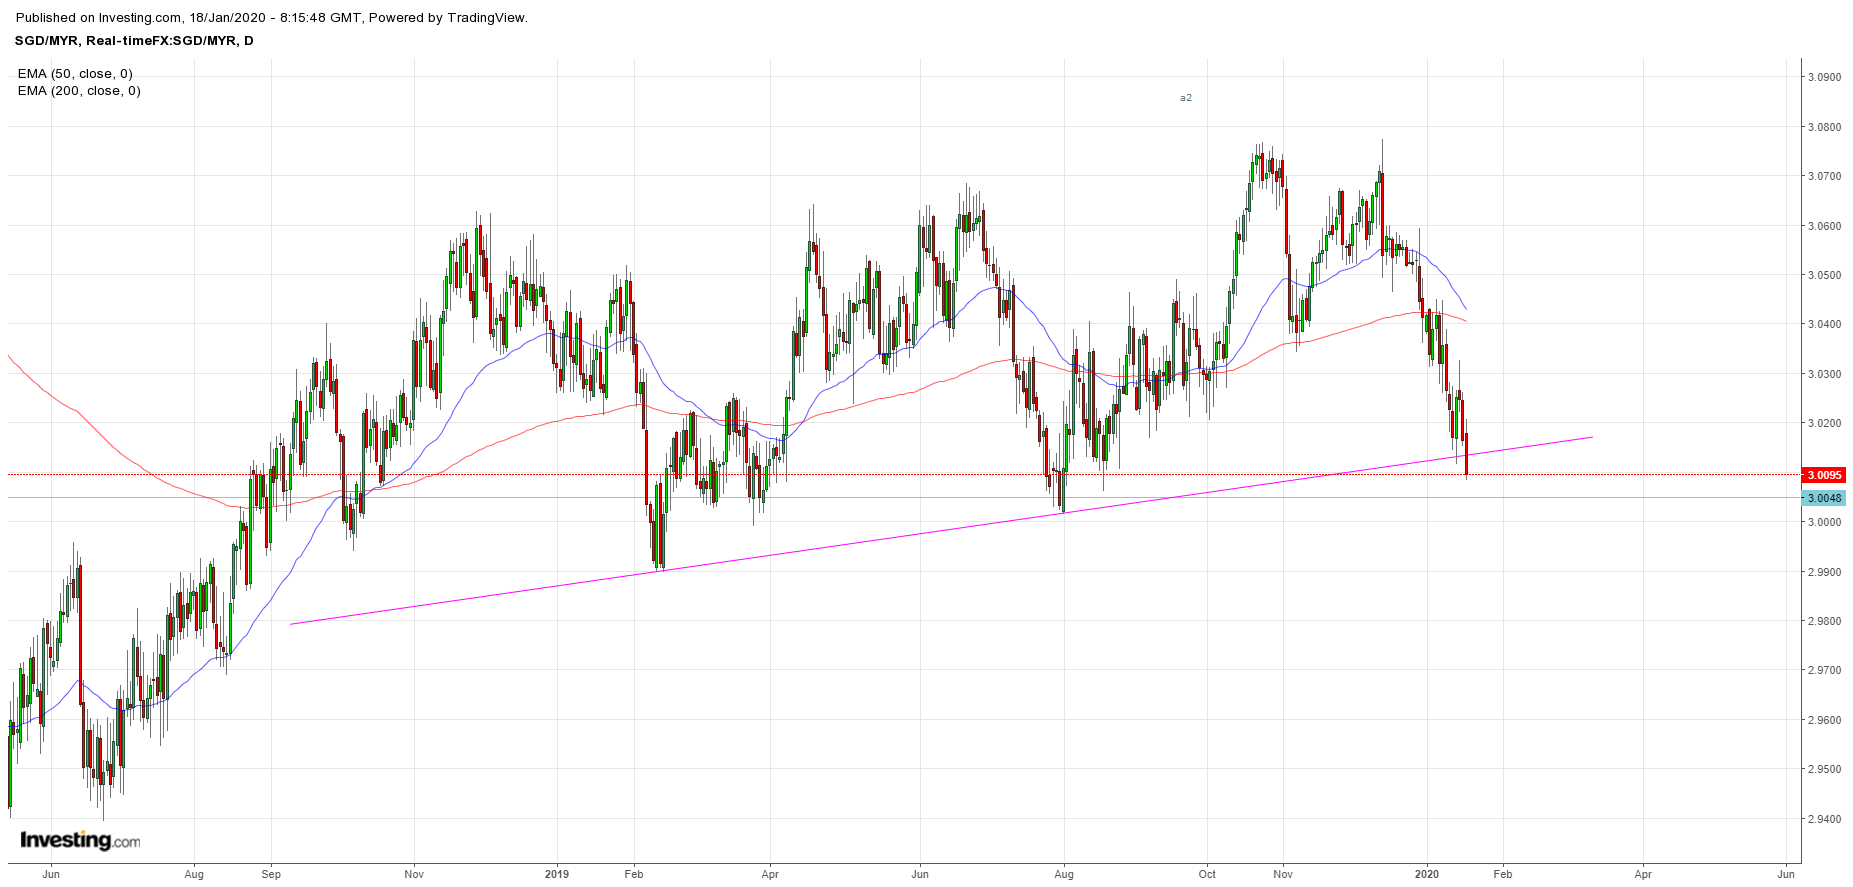
Obvious breakdown of neckline for SGDMYR. Immediate target likely to be 2.5-2.60. Long term target will be below 2 and likely to take 15-20 years to complete.
Discussions
Be the first to like this. Showing 0 of 0 comments
Post a Comment
Featured Posts


Latest Videos


Apps


Top Articles
1
2
My Trading Adventure 2025
3
https://dividendguy67.blogspot.com
4
Double Swords 双剑论股
5
Double Swords 双剑论股
6
Double Swords 双剑论股
7
Double Swords 双剑论股
8
Double Swords 双剑论股
#
Stock
Score
Daily Stocks
Stock Name
Last
Change
Volume
Stock Name
Last
Change
Volume
Stock Name
Last
Change
Volume
MQ Trading Signals
Stock
Time
Signal
Duration
No trading signals available.
Stock
Time
Signal
Duration
No trading signals available.
Featured Advertisers / Partners


Ride The Bull Short The Bear
CS Tan
4.9 / 5.0
This book is the result of the author's many years of experience and observation throughout his 26 years in the stockbroking industry. It was written for general public to learn to invest based on facts and not on fantasies or hearsay....