


chan sifu
陈师傅学堂 Master Chan TA COURES~2

chansifu
Publish date: Tue, 06 Dec 2016, 12:14 AM
chansifu
0 260
同心协力~美梦成真
擺脫賠錢的宿命
散戶唯有改變自己的投資心態,讓自己是在「經營股票」,而不是在「玩股票」,才有機會在股海裡勝出。
http://chansifu8.blogspot.my/
All the writings in this weblog are mainly for PLEASURE reading purposes. I am in NO position to recommend a call(BUY/SELL). Please check with those know-hows before you make a decision.trade at your own risk.
擺脫賠錢的宿命
散戶唯有改變自己的投資心態,讓自己是在「經營股票」,而不是在「玩股票」,才有機會在股海裡勝出。
http://chansifu8.blogspot.my/
All the writings in this weblog are mainly for PLEASURE reading purposes. I am in NO position to recommend a call(BUY/SELL). Please check with those know-hows before you make a decision.trade at your own risk.
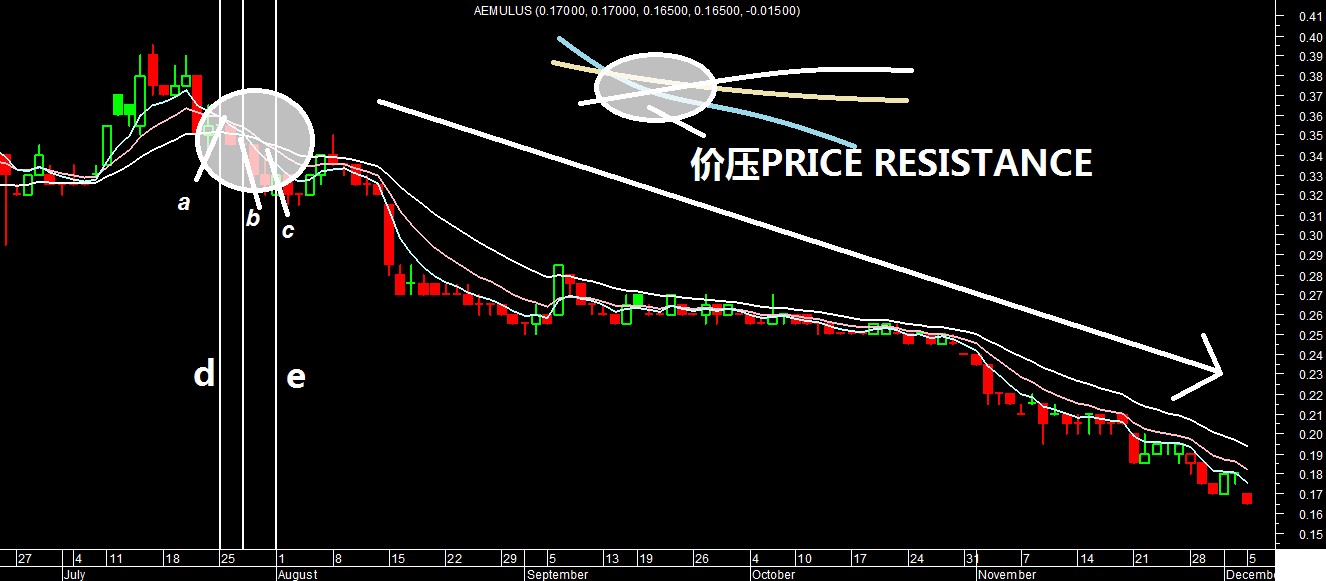
价压PRICE RESISTANCE (TOP SIGNAL)price pressure
图形特征:(以月价压为例)
由三条价格平均线自下而上,然后扭转向下所形成的封闭三角形
请看(图2-1)所示。
图中a所指是5日均价线向下死叉10日均价线所形成的结点;
图中b所指是5日均价线向下死叉20日均价线所形成的结点;
图中c所指是10日均价线向下死叉20日均价线所形成的结点。
由这三个结点组成一个封闭的三角形,这个三角形就称为“价压”。
图中d线段以前的月均线系统呈多头排列,在没有出现价压之前就没有形成头部的可能,
而在图中e线段以后的月均线系统呈空头排列,只要保持空头排列下跌行情就还将继续。
Graphic features: (the monthly price pressure as an example)
From the three price averages line from bottom to top, and then reverse down the formation of the closed triangle
See Figure 2-1.
Figure a refers to the 5-day average price of Sicha 10-day average price line formed by the node;
Figure b refers to the 5-day average price line down the Sicha 20 average price line formed by the node;
Figure c refers to the average price of 10-day Sicha 20 average price line formed by the node.
By the three nodes to form a closed triangle, the triangle is called "price pressure." Figure d line segment before the monthly average system was arranged in long, there is no price pressure before the formation of the head may not,In the figure e line segment after the monthly averages system was short order, as long as the short order to keep down the market will continue.
快乐学习HAPPY LEARNING WELCOME JOIN MY TELEGRAFor more Real time information
More articles on chan sifu
要成为股市赢家-赚赚赚-必读 To be a winner in the stock market - earn money- must reading
Created by chansifu | Nov 18, 2018
Featured Posts


Latest Videos


Apps


Top Articles
1
Good Articles to Share
2
3
Mercury Securities Research
4
BFM Podcast
5
6
Koon Yew Yin's Blog
7
BFM Podcast
8
BFM Podcast
#
Stock
Score
Daily Stocks
Stock Name
Last
Change
Volume
Stock Name
Last
Change
Volume
Stock Name
Last
Change
Volume
MQ Trading Signals
Stock
Time
Signal
Duration
Stock
Time
Signal
Duration
Featured Advertisers / Partners


Ride The Bull Short The Bear
CS Tan
4.9 / 5.0
This book is the result of the author's many years of experience and observation throughout his 26 years in the stockbroking industry. It was written for general public to learn to invest based on facts and not on fantasies or hearsay....