


Funds Flow Analysis by TheFFAPractitioner
Why This Stock has Risen +160% in Two Weeks - A Funds Flow Perspective

TheFFAPractitioner
Publish date: Fri, 13 Nov 2020, 03:28 PM
The Fundamental Story
Aemulus recorded a loss of RM4.651 million in FPE2020. As a result, its share price consistently sidelined below 0.300 for the majority of 2019 and half of 2020. More importantly, R&D expenses have increased approximately RM0.697 million or 24% as compared to FPE2019, in tandem with the company's continued investment in R&D.
Now, its important to note that the fall in revenue of 43% or RM9.18 million as compared to FPE2019 was attributable to the soft demand for test system from the enterprise storage market segment as well as the impact of COVID- 19 pandemic and implementation of travel and other restrictions locally and globally. Make no mistake, at this point of time, the company was not performing well both financially and in terms of technological advancement.
In fact, the company’s sales had flagged for the longest time because it had designed a generic tester, the AMB 5600, which had been all but impossible to move.
The Wind of Change
Soon after, the company made a radical decision to modify its usual tester into a specialised tester in an attempt to breach into a niche market. The company received immediate orders for this product, which was launched during the MCO period in both Taiwan and China.
Not withstanding the above, Aemulus being one of the few companies in Asia that own the intellectual properties to design and develop RF testers had entered a Joint-Venture with China’s Tangren Microtelligence Co Ltd to monetize the intellectual property rights of its radio frequency tester. With an investment of RM6.67 million into the JV, Aemulus owned a 40%-stake in the JV.
----
The Funds Flow Analysis of Aemulus in July
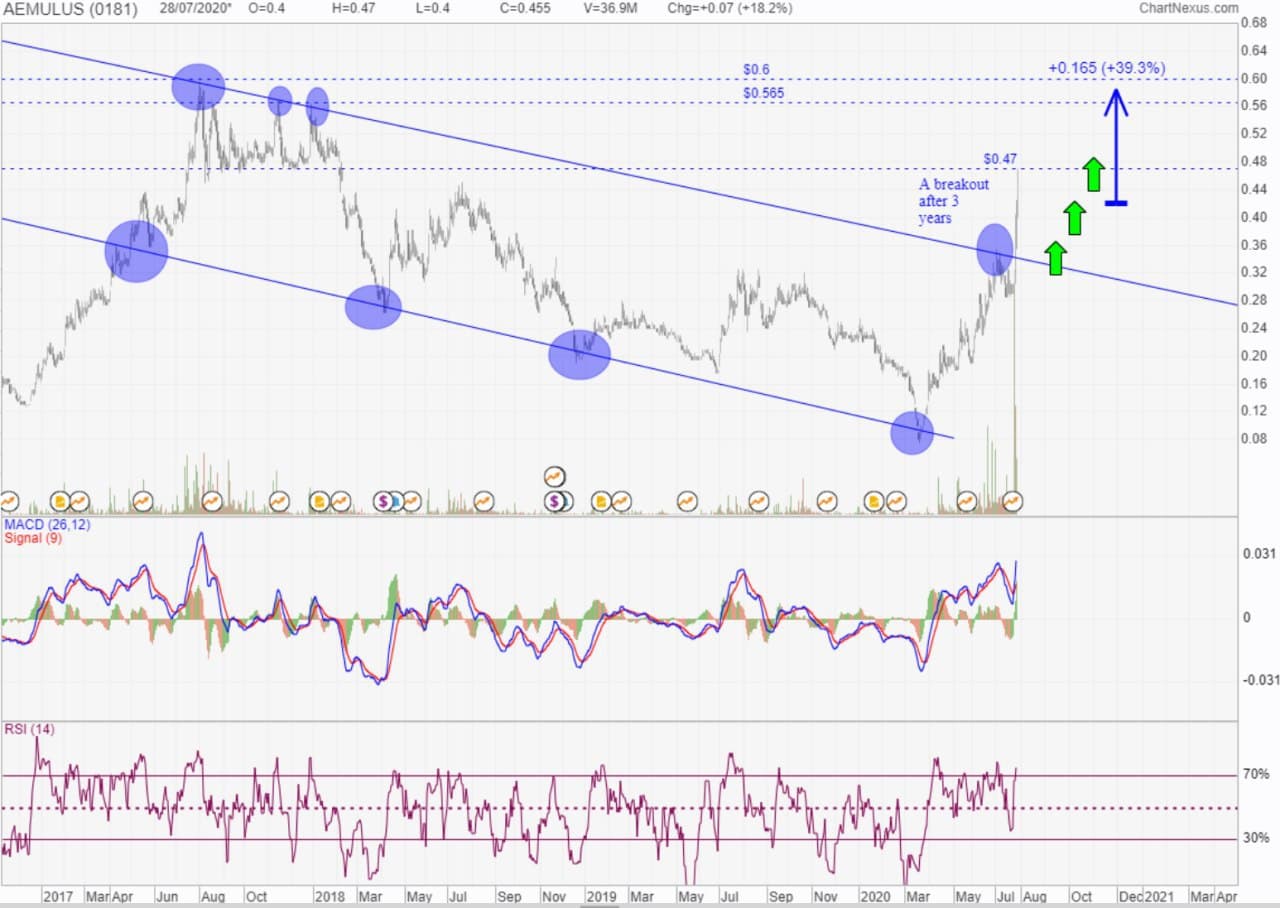
Observe the multi-backtested downtrend channel lines drawn above. The circled area are where the channel lines have previously been backtested and failed to breach. Observe that the very recent breakout of the long term downtrend channel lines have yielded volume like never seen before. This volume is more than double the volume during the initial entry into the channel lines back in August 2017. The final bottom in March 2020 has yielded very high volume up until today. In funds flow theory, we call this the 'triple trinity of forces', in which retailers, smart monies, big monies are all collecting at the same time, leading to the breakout this week. In the short term, expect Aemulus to retest 0.600 the critical resistance, before hitting RM1.00 in the mid term.
----
The Funds Flow Analysis of Aemulus in August
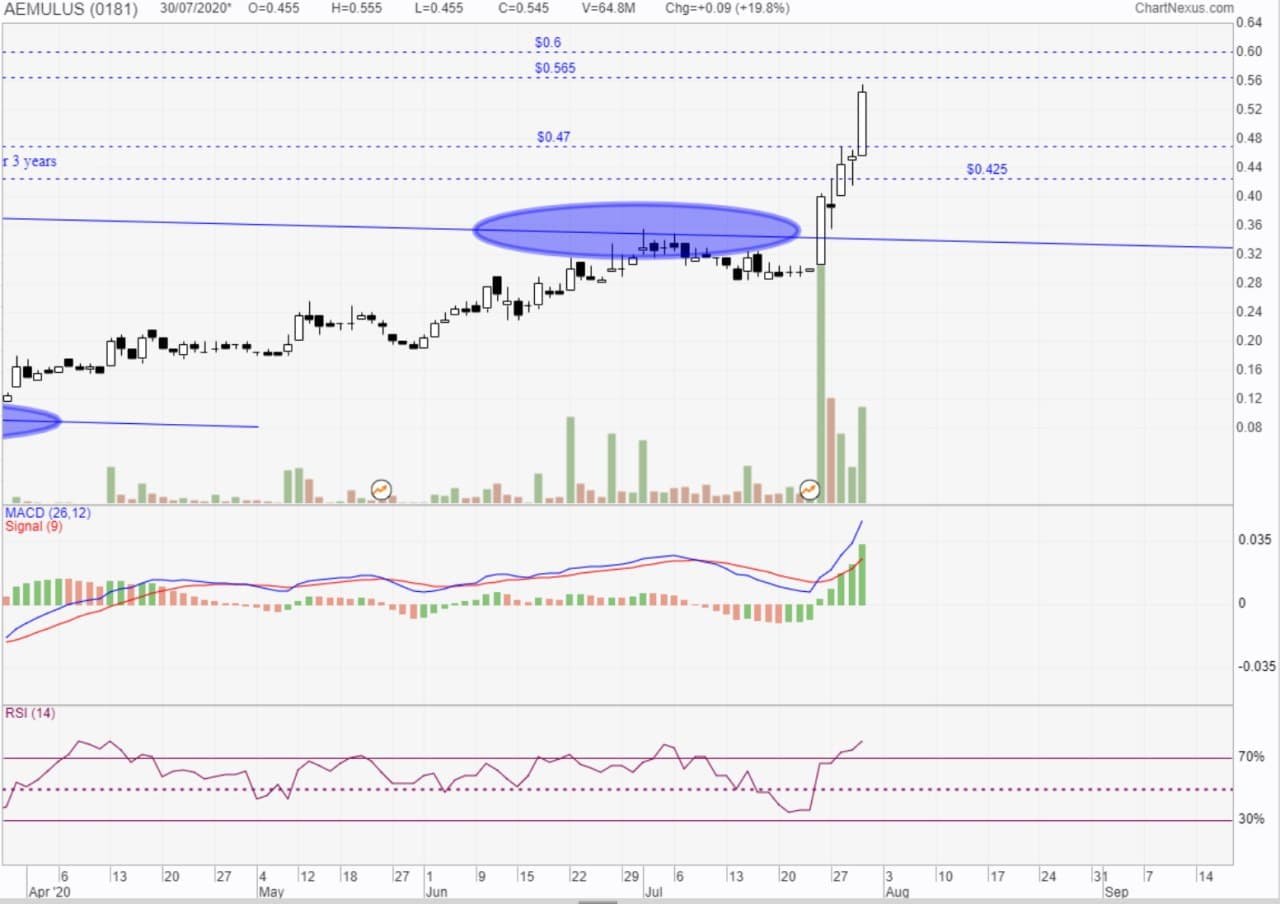
Zooming into the chart to see a short term perspective, we can clearly see that Aemulus is on a rocket ship upwards. Each long white candle yields a profit taking candle, which indicates healthy correction and the flushing out of what we call the 'foolish herd' in funds flow methodology. This herd signifies those that are happy with their 5-10 bids profit and hence are taking profits early, but based on the funds flow methodology, there was nothing stopping Aemulus at this stage in time.
----
The Recent Funds Flow Analysis of Aemulus
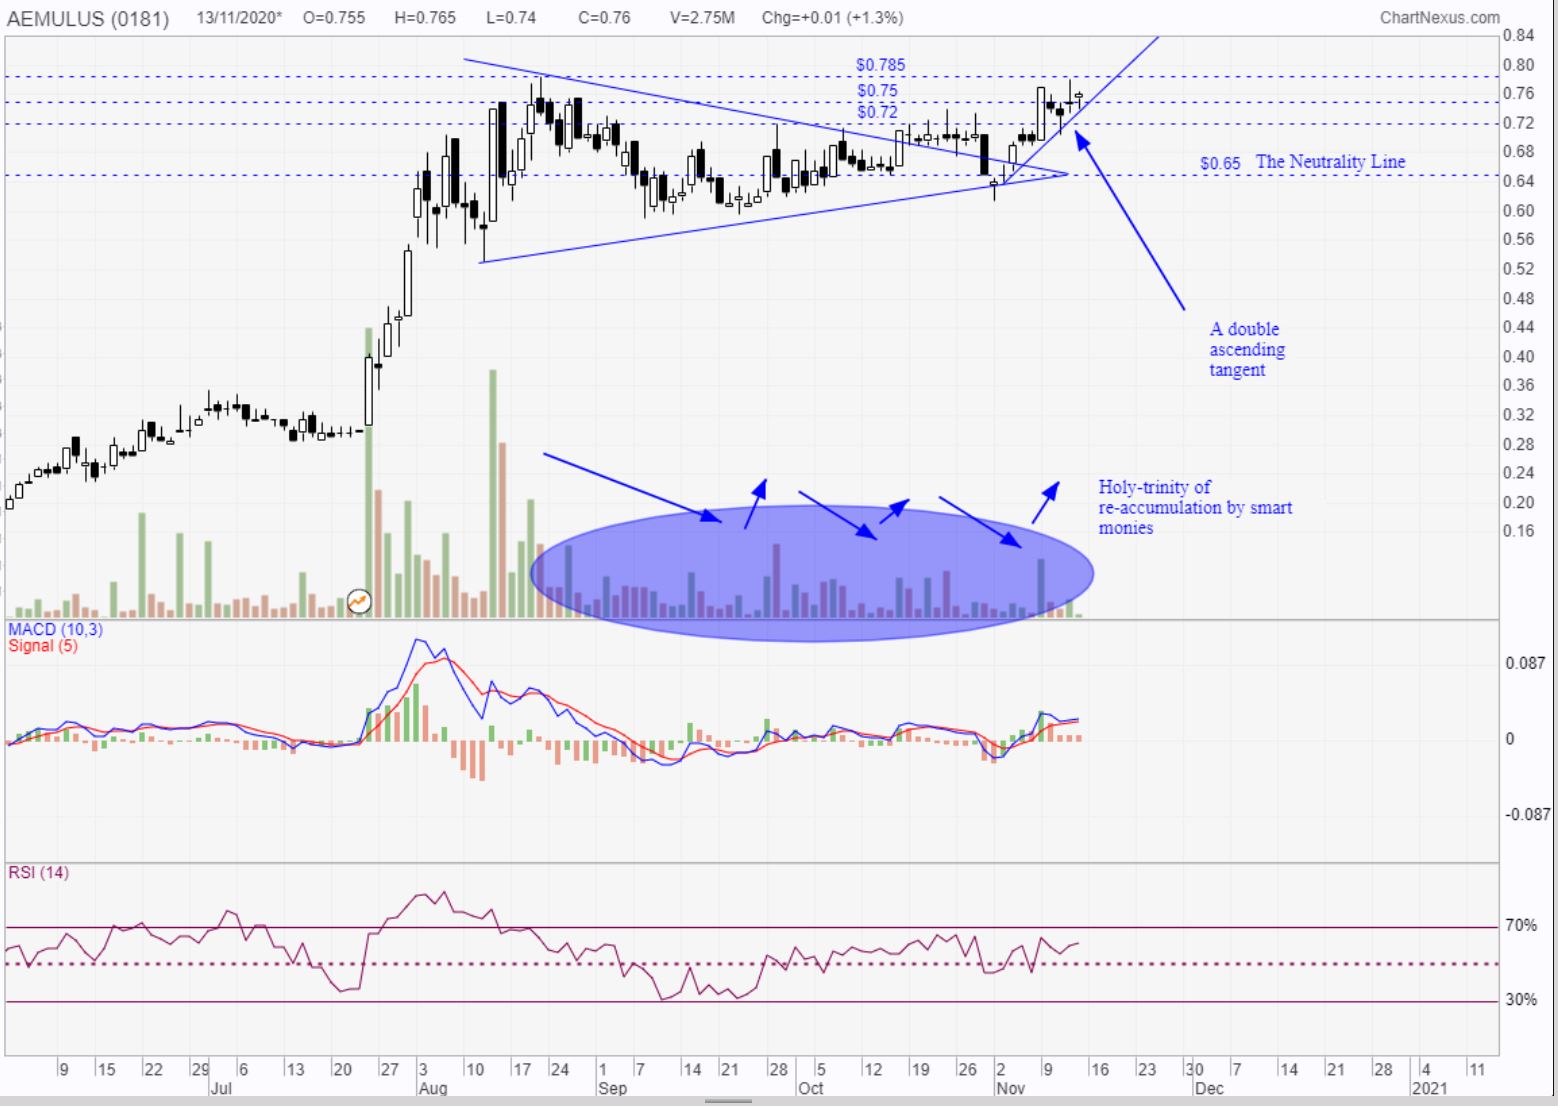
Observe the symmetrical triangle breakout drawn above. The breakout is a two-month long consolidation after a sharp rise in Aemulus' price (refer to above funds flow analysis) which centred around of 0.650. Now, carefully observe the falling volume accumulation as shown above, whereby in funds flow theory, we describe this as a sign of impuslive re-accumulation by smart monies. The subsequent drop in volume during falling candles successfully washed out the foolish retailers who believed that the show was over for Aemulus. The high spikes in each round drawn above signifies a rush to buy back by all three forces of bullish smart monies.
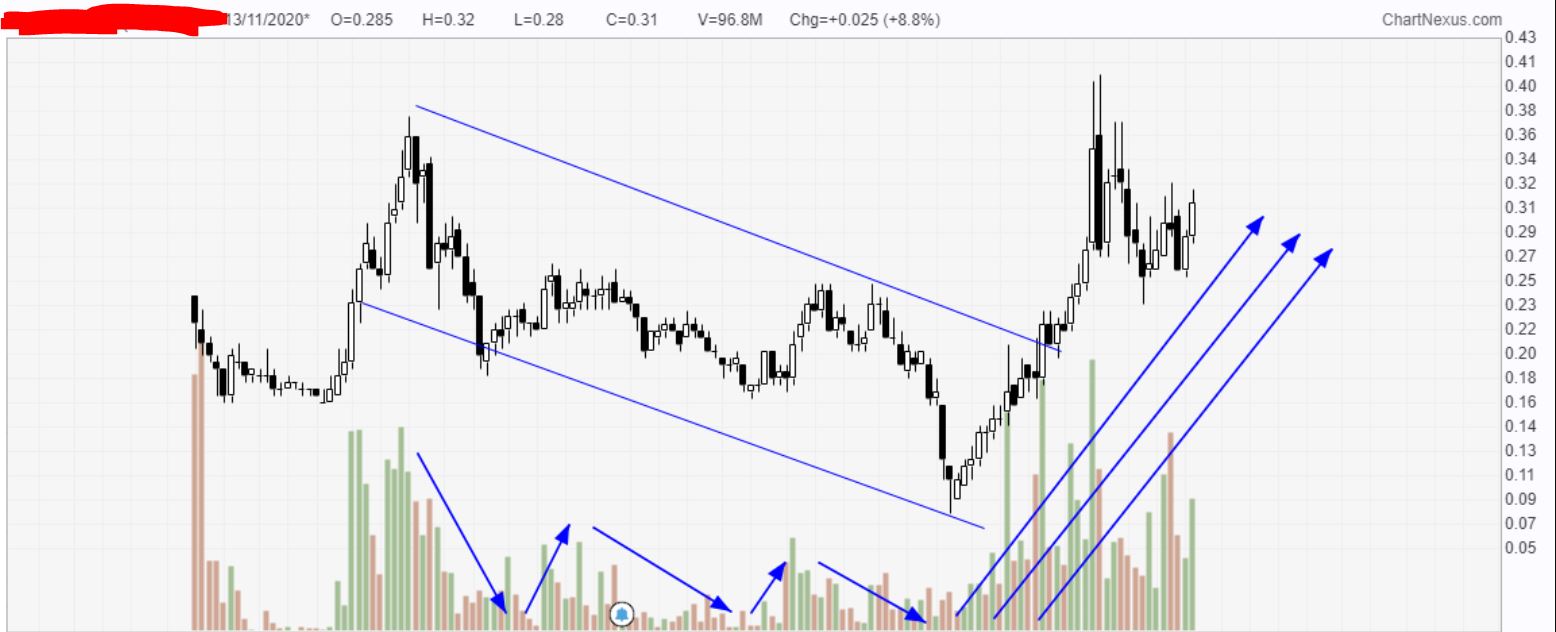
To illustrate an example, refer to the chart below, whereby the holy-trinity of accumulation has successfully completed its funds flow methodology principle:
Aemulus will see new highs like never before.
----
Disclaimer:
The descriptions and analysis in the blog are of the personal opinion of the author and is solely for knowledge and educational purposes. No buy/sell call is given. Investors should do their own prior research before committing to an investment.
The descriptions and analysis in the blog are of the personal opinion of the author and is solely for knowledge and educational purposes. No buy/sell call is given. Investors should do their own prior research before committing to an investment.
----
-TheFFAPractitioner
Related Stocks
| Chart | Stock Name | Last | Change | Volume |
|---|
More articles on Funds Flow Analysis by TheFFAPractitioner
The Funds Flow of Bursa (1818) Before and After the Reimplementation of CMCO
Created by TheFFAPractitioner | Oct 20, 2020
Featured Posts


Latest Videos


.png)


MQ Trading Signals
Time
Signal
Duration
Type
2024-09-02 11:30:00
EMA 5
5 Mins
BUY
2024-09-02 11:25:00
ADX
5 Mins
BUY
2024-09-02 11:20:00
EMA 5
10 Mins
BUY
2024-09-02 11:10:00
EMA 5
10 Mins
SELL
2024-09-02 11:05:00
EMA 5
5 Mins
SELL
Apps


Top Articles
1
https://dividendguy67.blogspot.com
2
3
5
https://dividendguy67.blogspot.com
6
https://dividendguy67.blogspot.com
7
Stock Market Enthusiast
CIMB: Uptrend Continues - Is the Best Yet to Come? (Uptrend + Bullish) - KingKKK
8
Good Articles to Share
Pacific leaders remove Taiwan from communique after China complaint
#
Stock
Score
Daily Stocks
Stock Name
Last
Change
Volume
Stock Name
Last
Change
Volume
Stock Name
Last
Change
Volume
Featured Advertisers / Partners


Ride The Bull Short The Bear
CS Tan
4.9 / 5.0
This book is the result of the author's many years of experience and observation throughout his 26 years in the stockbroking industry. It was written for general public to learn to invest based on facts and not on fantasies or hearsay....
Edgratia
Awesome analysis from FF point of view rather than normal chart analysis
2020-11-13 16:01