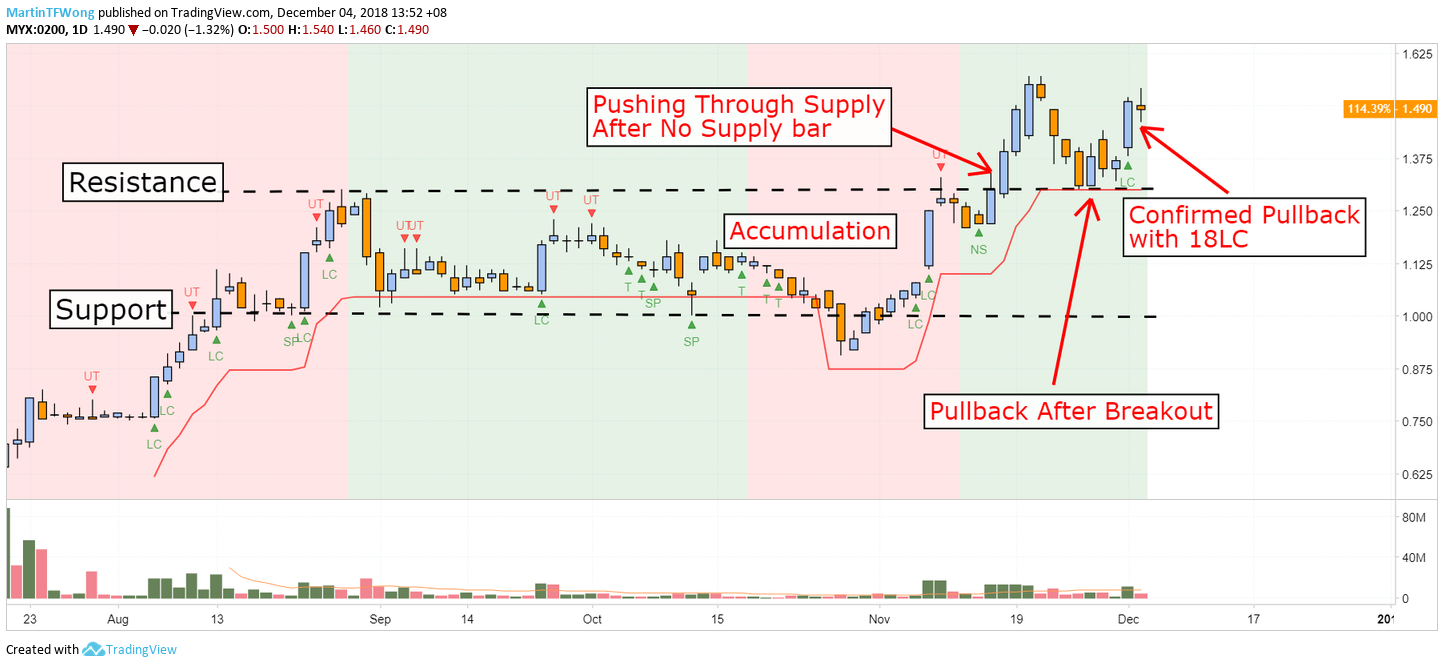
Revenue (0200.KL) Completed Pullback Pattern
TradeVSA
Publish date: Tue, 04 Dec 2018, 02:24 PM

A pullback simply represents any price movement that is against the prevailing trend. A pullback is a short-term move in the opposite direction of the longer-term trend. It can offer an opportunity to join the trend without chasing the stock.
Using Revenue daily chart as example, we have found a pullback trade after the accumulation stage. Based on Volume Spread Analysis, we saw several sign of strengths in the background:
- 2 months of accumulation stage with a shakeout below support level
- A confirmation of shakeout with Pushing Through Supply on 16 November 2018
- Price supported well at previous resistance level on RM1.30
- A confirmation of pullback signal with a 18 Line Change with volume
Stop Loss = $1.37
1st Target = $1.57
2nd Target = $1.63 or Sign of Weakness
Send us your preference stock to review based on TradeVSA chart by comment at below. We will post the chart with comment at www.facebook.com/MartinTFWong
Visit TradeVSA website for the FREE 18Line Change Screener to look for other potential trades:
https://tradevsa.com/screener/18lc_us.php
Interested to learn more?
· FREE Webinar, 9 December (Sun), 2pm: https://bit.ly/2PwmviH
· Visit our website for FREE Stock Screener: https://tradevsa.com/
· Contact us via: email at support@tradevsa.com or Call/WhatsApp at +6010 266 9761
Disclaimer
This information only serves as reference information and does not constitute a buy or sell call. Conduct your own research and assessment before deciding to buy or sell any stock.
Related Stocks
| Chart | Stock Name | Last | Change | Volume |
|---|


