


AmInvest Research Reports
Stocks on Radar - Gamuda (5398)

AmInvest
Publish date: Thu, 09 Dec 2021, 09:39 AM
AmInvest
0 9,382
An official blog in I3investor to publish research reports provided by AmInvest research team.
All materials published here are prepared by AmInvest. For latest offers on AmInvest trading products and news, please refer to: https://www.aminvest.com/eng/Pages/home.aspx
Tel: +603 2036 1800 / +603 2032 2888
Fax: +603 2031 5210
Email: enquiries@aminvest.com
Office Hours
Monday to Thursday: 8:45am – 5:45pm
Friday: 8:45am – 5:00pm
(GMT +08:00 Malaysia)
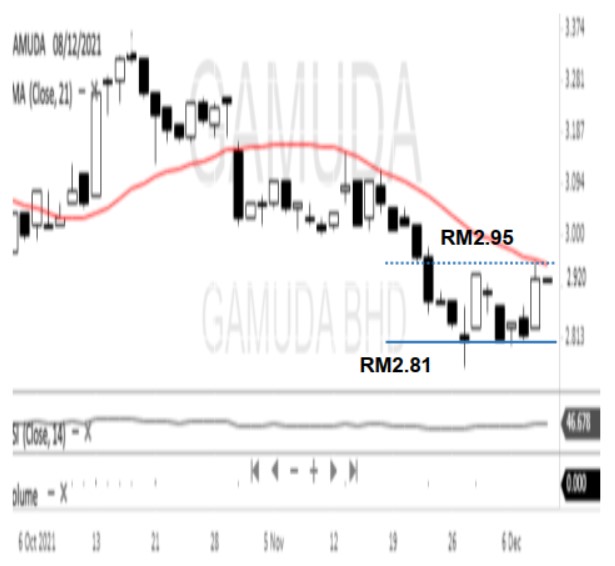
Gamuda rose and hit the RM2.95 resistance level. With its RSI indicator pointing upward, coupled with a bullish white candle stick pattern, there is a good chance that it would experience a technical breakout and head towards the short-term target price of RM3.05, followed by RM3.10. The downside support is marked at RM2.81. Traders are advised to exit on a breach to avoid further losses.
Trading Call: Buy on breakout RM2.95
Target: RM3.05, RM3.10 (time frame: 2-4 weeks)
Exit: RM2.81
Source: AmInvest Research - 9 Dec 2021
Related Stocks
| Chart | Stock Name | Last | Change | Volume |
|---|
Market Buzz
2024-11-24
GAMUDA2024-11-23
GAMUDA2024-11-22
GAMUDA2024-11-22
GAMUDA2024-11-22
GAMUDA2024-11-22
GAMUDA2024-11-21
GAMUDA2024-11-21
GAMUDA2024-11-21
GAMUDA2024-11-20
GAMUDA2024-11-20
GAMUDA2024-11-20
GAMUDA2024-11-20
GAMUDA2024-11-19
GAMUDA2024-11-19
GAMUDA2024-11-19
GAMUDA2024-11-19
GAMUDA2024-11-19
GAMUDA2024-11-18
GAMUDA2024-11-18
GAMUDA2024-11-18
GAMUDA2024-11-18
GAMUDA2024-11-15
GAMUDA2024-11-15
GAMUDA2024-11-15
GAMUDA2024-11-15
GAMUDA2024-11-15
GAMUDA2024-11-15
GAMUDA2024-11-15
GAMUDA2024-11-14
GAMUDA2024-11-14
GAMUDA2024-11-14
GAMUDA2024-11-14
GAMUDA2024-11-14
GAMUDA2024-11-13
GAMUDA2024-11-13
GAMUDA2024-11-13
GAMUDA2024-11-12
GAMUDA2024-11-12
GAMUDA2024-11-12
GAMUDA2024-11-12
GAMUDAMore articles on AmInvest Research Reports
Petronas Chemicals - Closing in to floor on multi-year low foreign holdings
Created by AmInvest | Nov 21, 2024
Discussions
Be the first to like this. Showing 0 of 0 comments
Post a Comment
Featured Posts


Latest Videos


Apps


Top Articles
1
2
4
save malaysia!
Visa-free travel to China extended for Malaysians to 30 days
5
6
7
Good Articles to Share
Iran to hold nuclear talks with three European powers in Geneva on Friday, Kyodo reports
8
Good Articles to Share
#
Stock
Score
Daily Stocks
Stock Name
Last
Change
Volume
Stock Name
Last
Change
Volume
Stock Name
Last
Change
Volume
Featured Advertisers / Partners


Ride The Bull Short The Bear
CS Tan
4.9 / 5.0
This book is the result of the author's many years of experience and observation throughout his 26 years in the stockbroking industry. It was written for general public to learn to invest based on facts and not on fantasies or hearsay....