


Bull and Bear
View on FBMKLCI

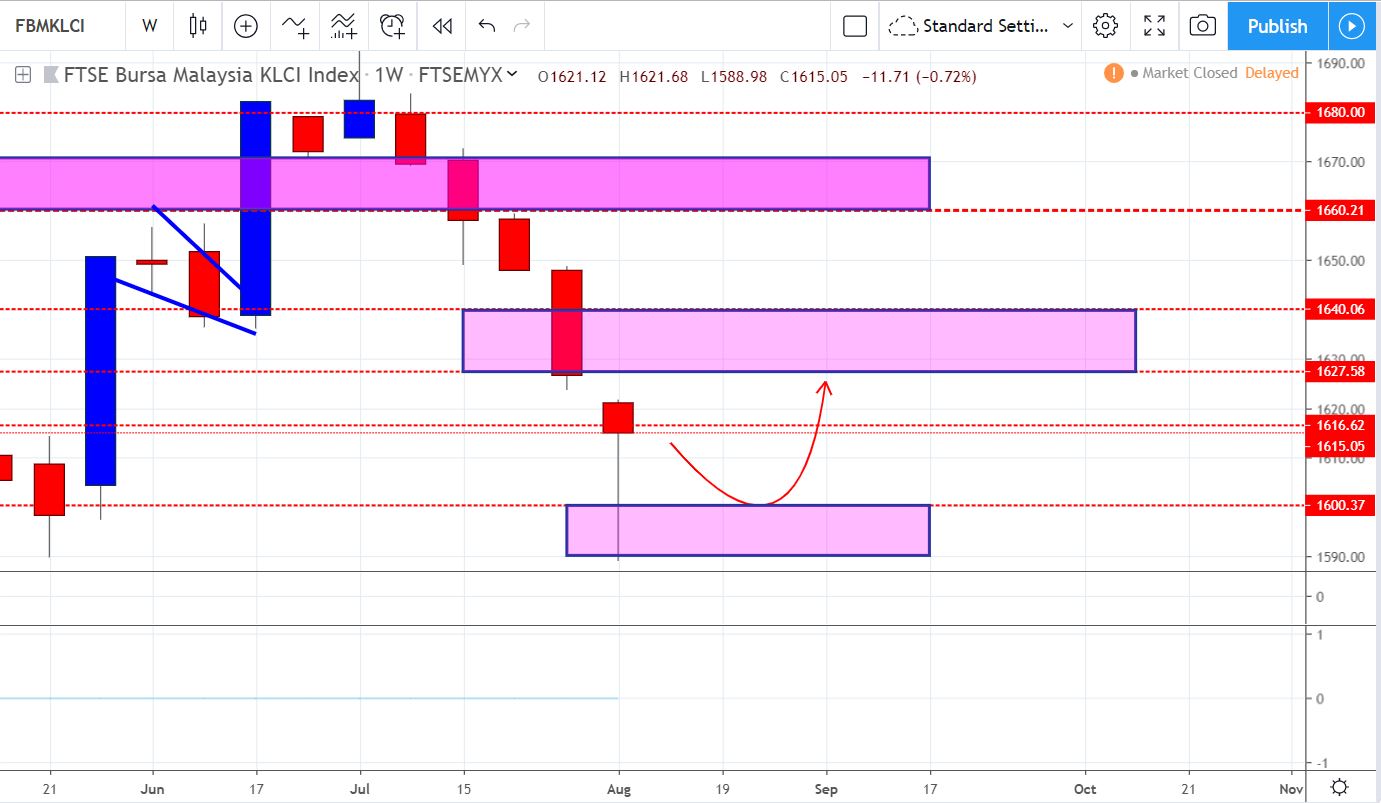
Weekly
For full explaination in video (in mandarin)... u may click below link:
https://www.youtube.com/watch?v=i6sJOP-ez8s&t=16s
KLCI weekly shows a hammer alike candle,
it shows that there are possible REBOUND on upcoming week. (well, hammer doesnt mean market will / confirm rebound)
it only shows Bear has weakening, and BULL has try to taking over the control.
 \
\
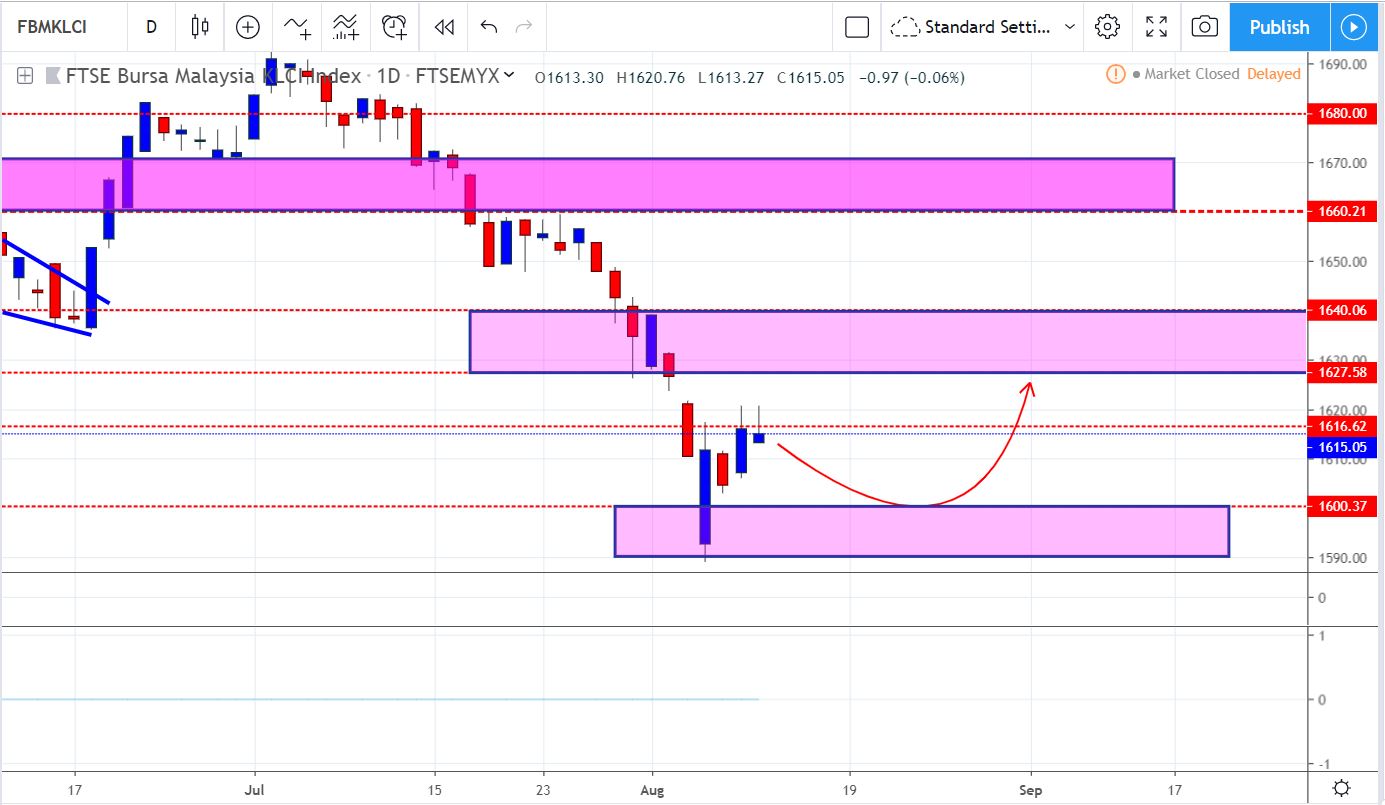
lets see on Daily chart..
if based on daily chart... BEAR structure still there.... as we can see classic higher low, lower low...
this bull fight back is due to market has oversold, ... and market try to make a rebound
(rebound NOT reversal... both are diff meaning)
for Resistance, we need to watchout
1616 , 1627, 1640
for Support, watchout
1600, 1590..
Follow our facebook page:
For Stocks , KLCI , Bursa
For Fx, futures and Crypto
Follow our Telegram:
For Fx, futures and Crypto
For Stocks , KLCI , Bursa
Disclaimer:
Please be informed that our analysis are solely for education purpose; it is neither a trading advice nor an invitation to trade.
For trading advice, please speak to your remisier or dealer representative.
You are responsible for your own risk management
Do Your Own Due Diligence (DYODD)
More articles on Bull and Bear

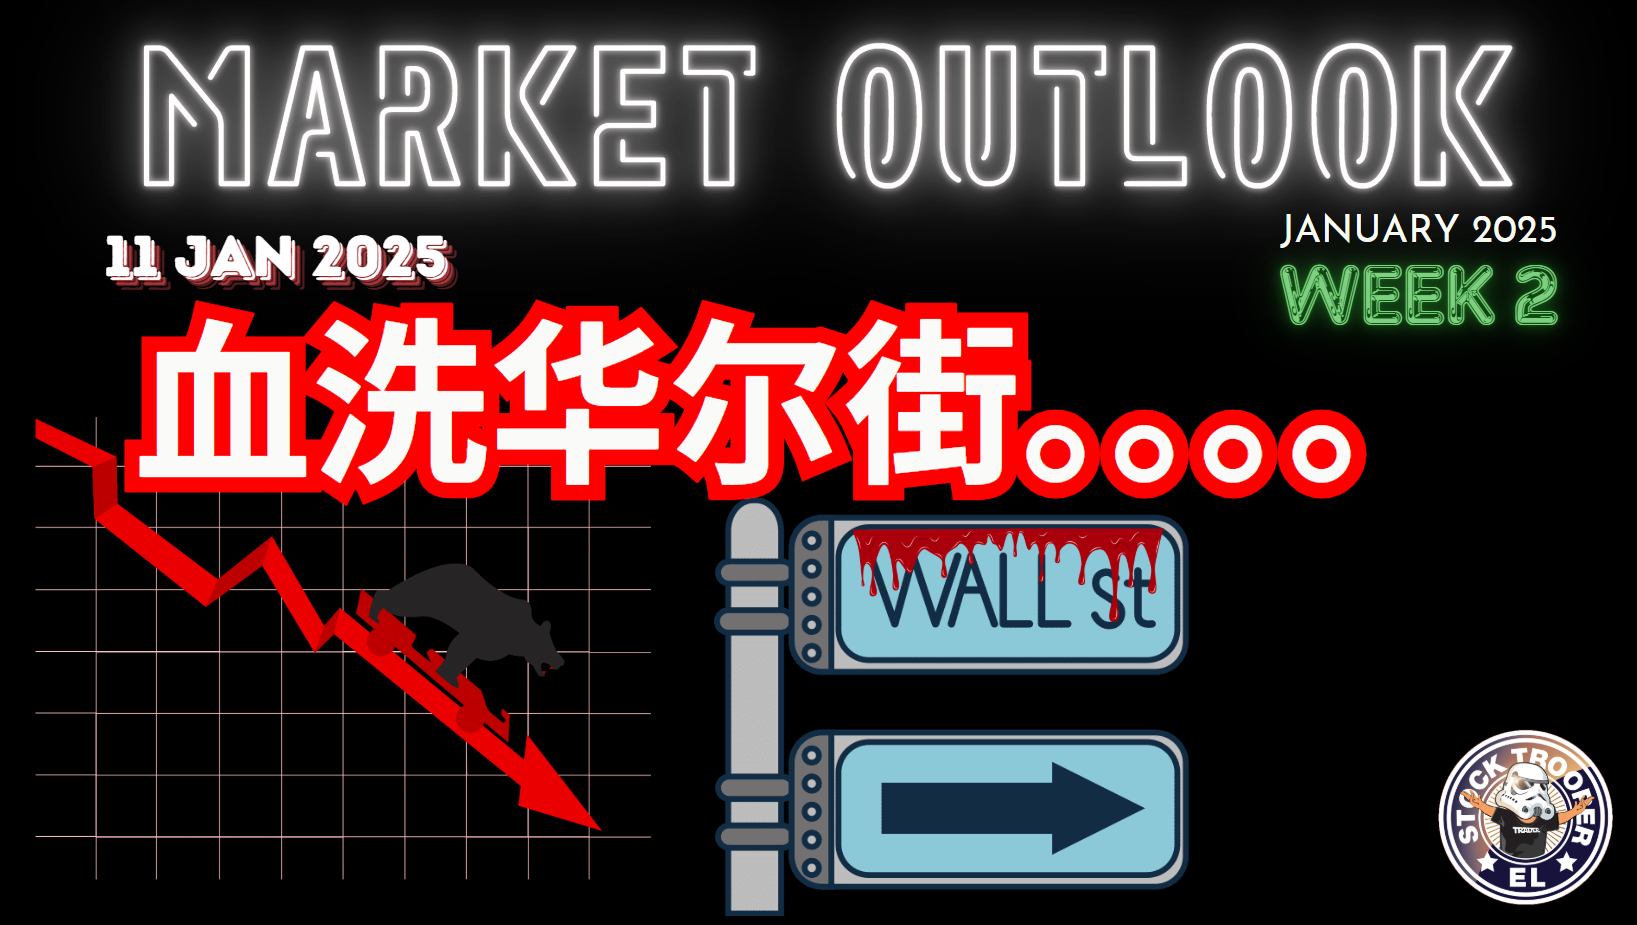
血洗华尔街。。。。 道琼斯_恒生_指數_分析_11-JANUARY-2025_ Market Outlook_Technical Analysis
Created by elp25 | Jan 11, 2025
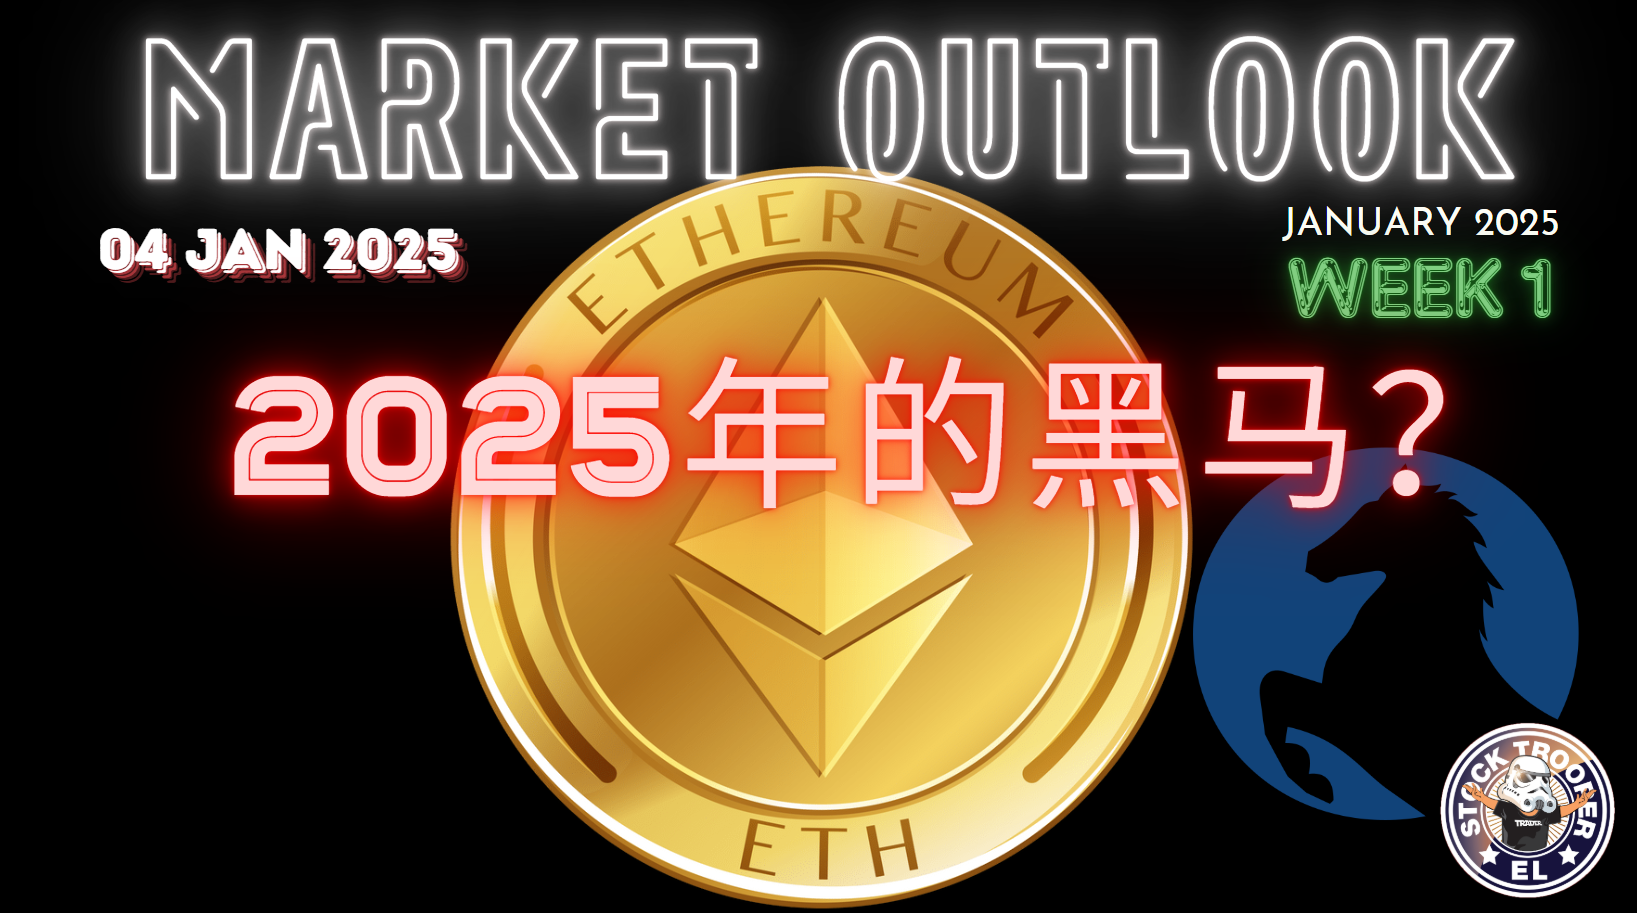
以太币将会是 2025年的黑马? 道琼斯_恒生_指數_分析_04-JANUARY-2025_ Market Outlook_Technical Analysis
Created by elp25 | Jan 04, 2025


提前,祝大家新年快乐| 道琼斯_恒生_指數_分析_14-DECEMBER-2024_ Market Outlook_Technical Analysis
Created by elp25 | Dec 21, 2024

油价,将反弹?| 道琼斯_恒生_指數_分析_14-DECEMBER-2024_ Market Outlook_Technical Analysis
Created by elp25 | Dec 14, 2024
Featured Posts
Introducing MY's First IPO Fund for Sophisticated Investors!
New Update. Discover investment communities that resonate with your ideas
M & A Value Partners IPO Equity Fund has been launched - Targeted 13% Return p.a
Latest Videos


Apps


Top Articles
1
Stock Market Enthusiast
YTLPower: Hammer + Oversold + Strong Support Level Means Bullish Reversal?
2
CEO Morning Brief
These Big-cap Stocks on Bursa Pay More Than 5% Dividend Yield
3
Mercury Securities Research
4
RHB Investment Research Reports
5
6
MQ Market Updates
7
Mercury Securities Research
8
Mercury Securities Research
#
Stock
Score
Daily Stocks
Stock Name
Last
Change
Volume
Stock Name
Last
Change
Volume
Stock Name
Last
Change
Volume
MQ Trading Signals
Stock
Time
Signal
Duration
Stock
Time
Signal
Duration
Featured Advertisers / Partners


Ride The Bull Short The Bear
CS Tan
4.9 / 5.0
This book is the result of the author's many years of experience and observation throughout his 26 years in the stockbroking industry. It was written for general public to learn to invest based on facts and not on fantasies or hearsay....