


https://dividendguy67.blogspot.com
FPI - Update

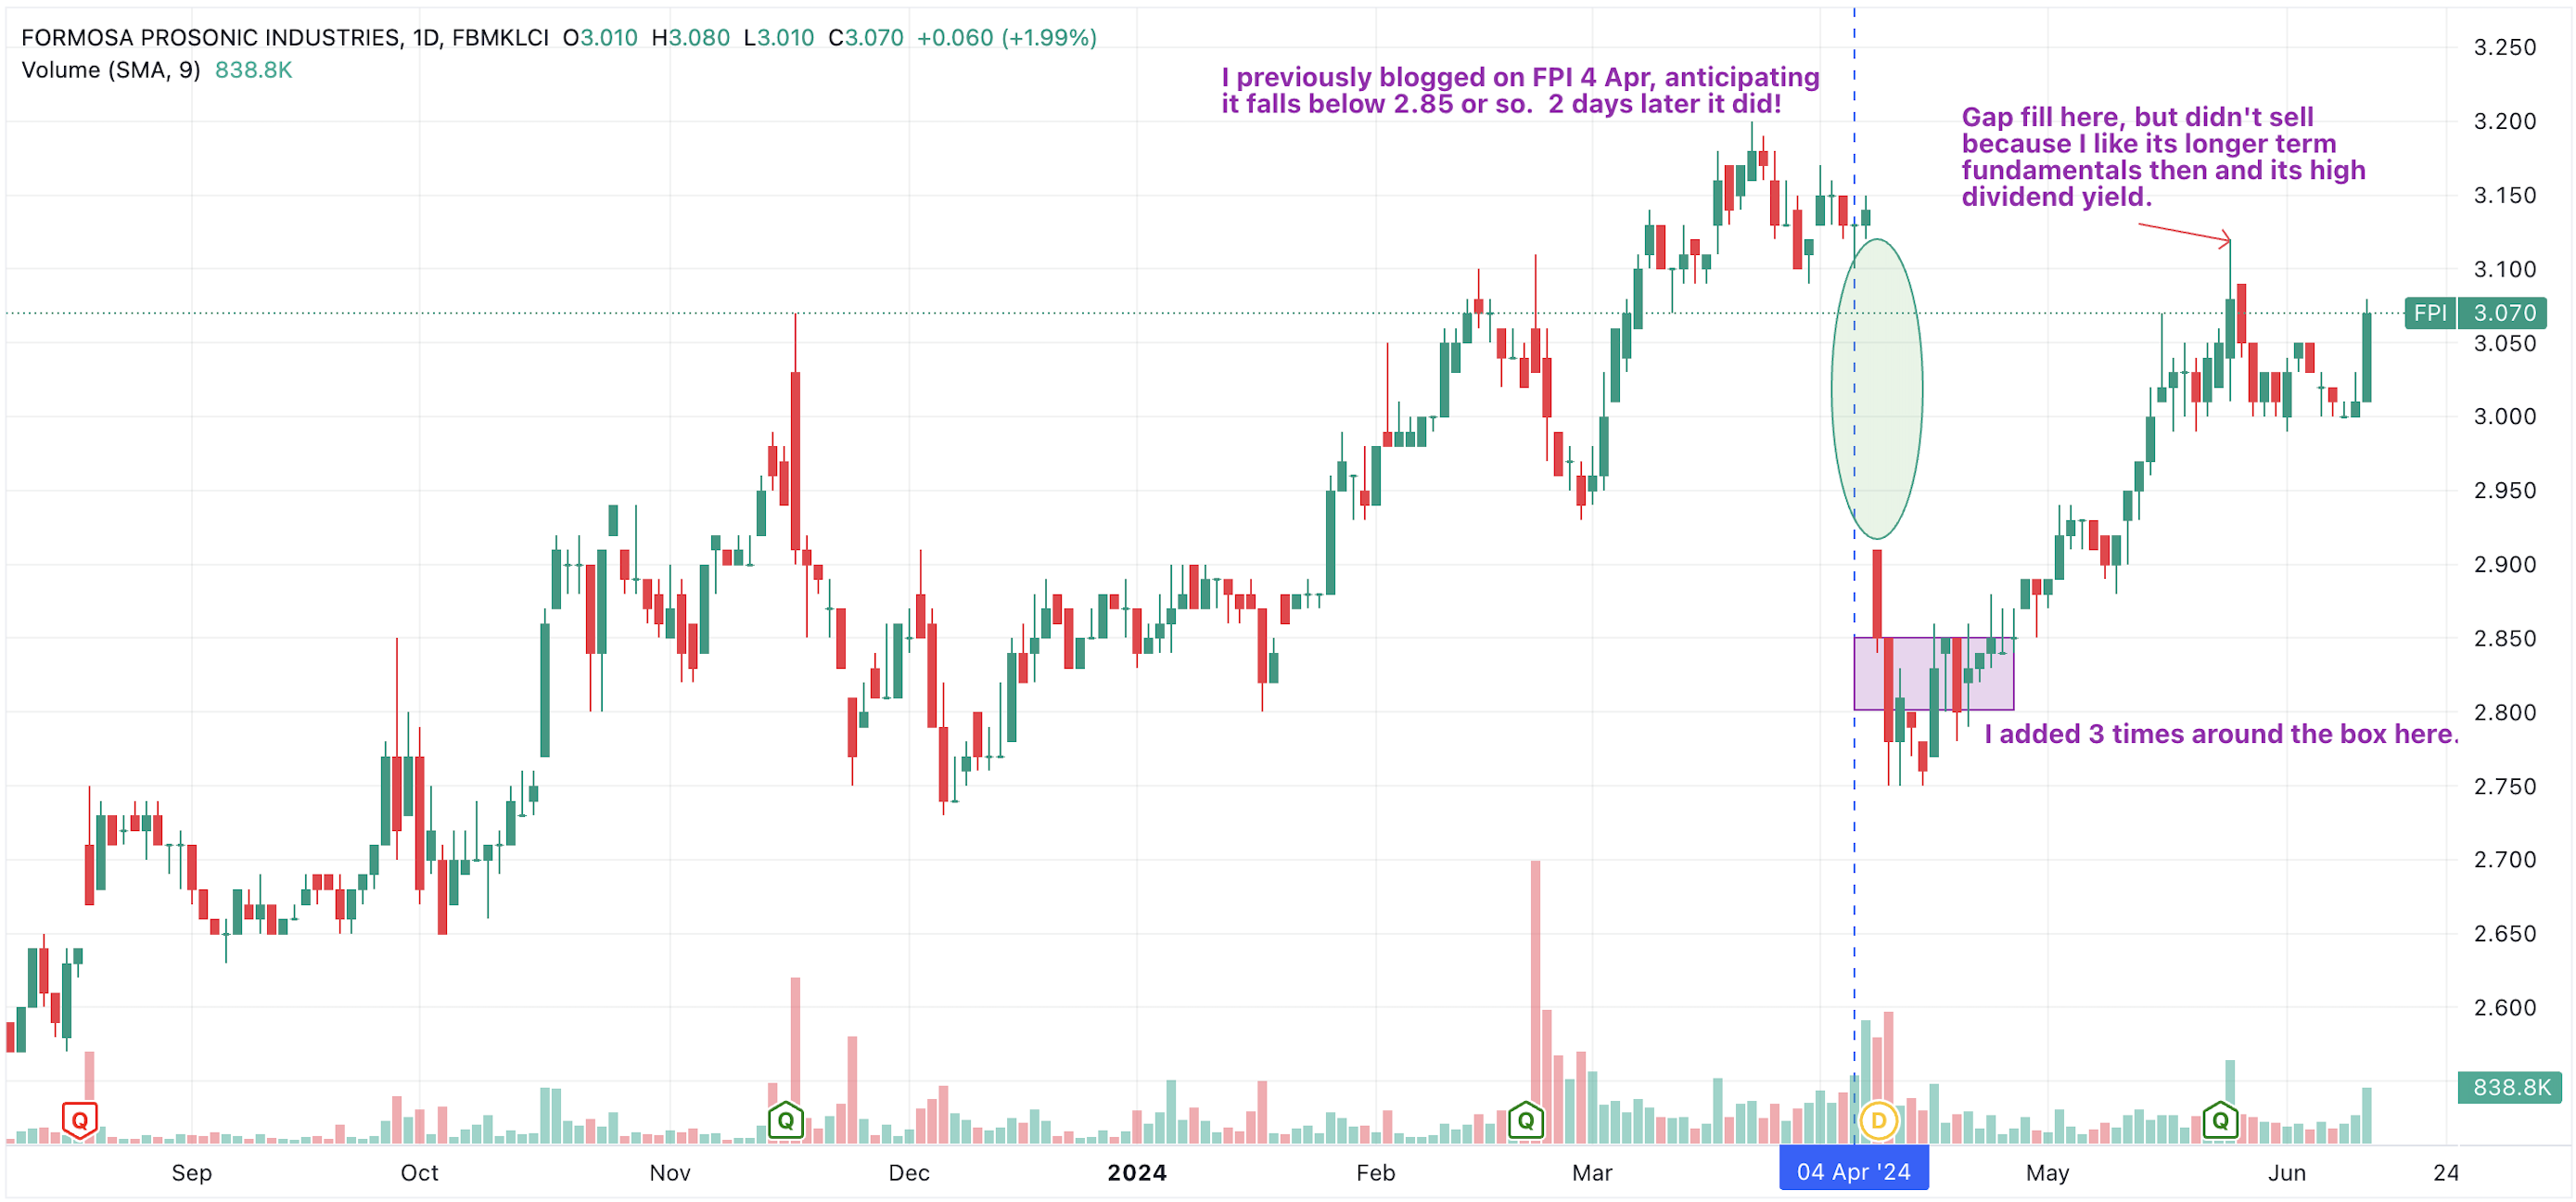
I previously blogged on FPI on 4 April here.
- At the time, I half anticipated that it would fall below 2.85.
- Little did I know that 2 days later, it did!
I then waited and added 3 times between 2.8 to 2.84.
- I am now fully positioned.
Then, FPI subsequently advanced, to fill the opening gap indicated
- But I didn't sell, because I like its fundamentals and its high dividend yield.
Then it dipped and then rise again to close at 3.07 today.
The Daily Candle chart for the narratives above below.
2 charts - the first is a daily candle chart to illustrate the narratives above.
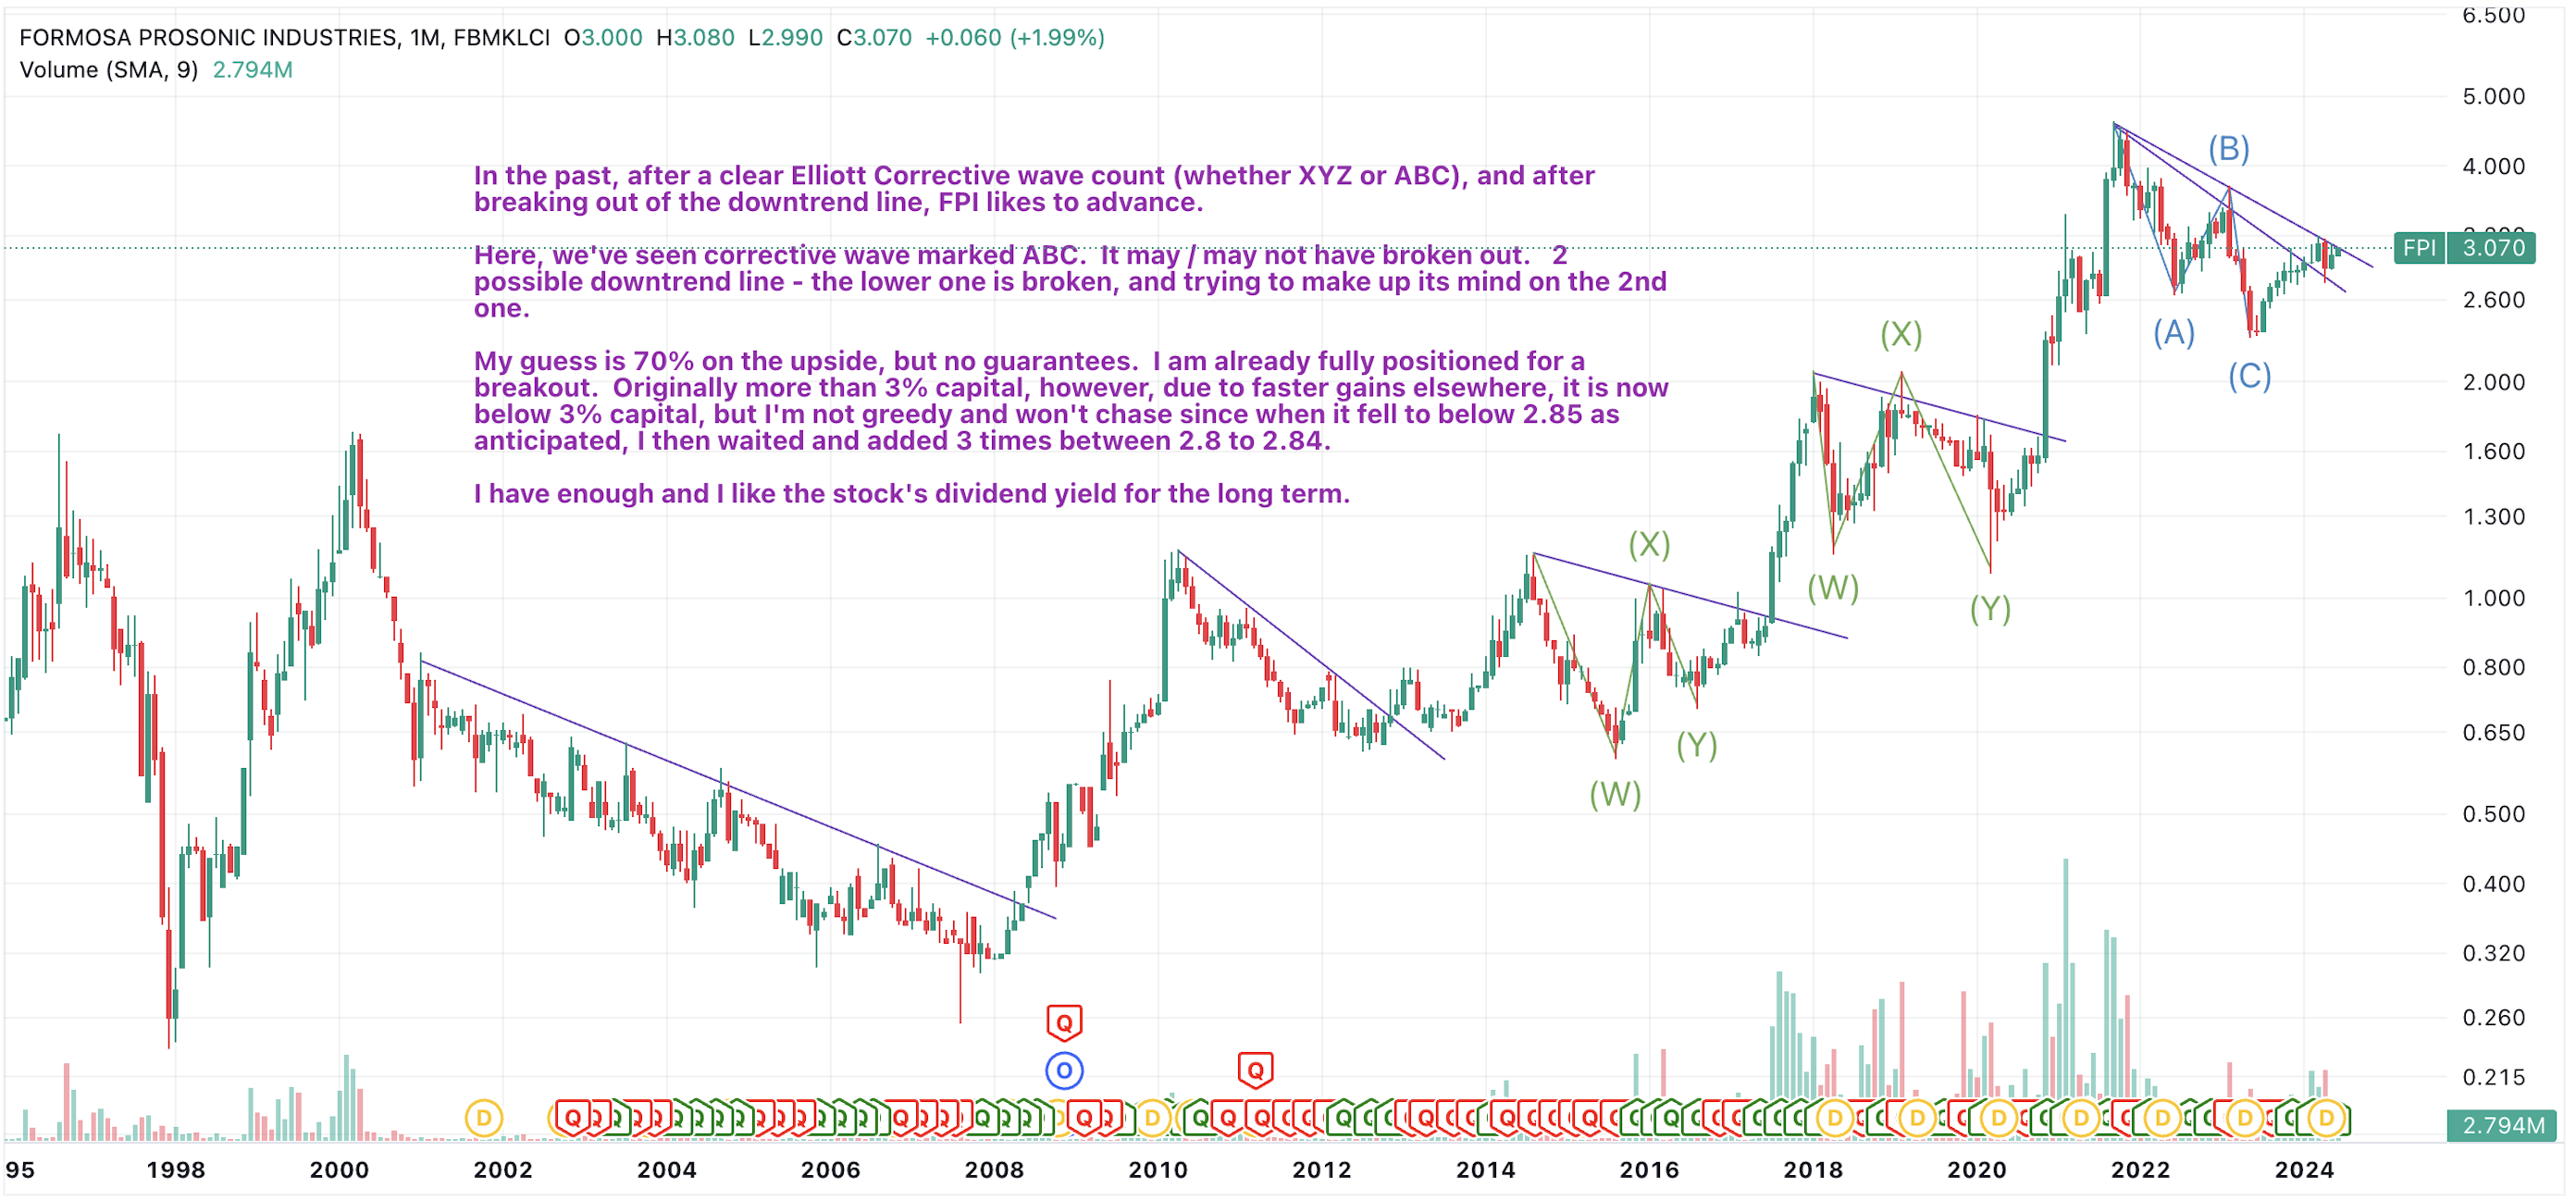
Below is an update to the standard monthly candle chart that I used to blog on my 4 April post.
My guess is 70% chance the breakout may be to the upside eventually, but nothing is guaranteed in trading. My long term dividend yield for this stock is in the range of 6%-7%, so, even if price falls, I am happy to do nothing and just hold to collect its dividends
I post this for future monitoring purposes only.
Disclaimer: As always, you are fully responsible for your own investing / trading decisions.
Related Stocks
| Chart | Stock Name | Last | Change | Volume |
|---|
More articles on https://dividendguy67.blogspot.com
IBIT Positions as at 24 Jan 2025 - Paper Gains $8,680 in a month!
Created by DividendGuy67 | Jan 25, 2025
How I created US$4,855 "dividend" income in less than 30 minutes
Created by DividendGuy67 | Jan 24, 2025
Happy January! Trump inaugurated, account new all time highs
Created by DividendGuy67 | Jan 22, 2025
Featured Posts


Latest Videos


Apps


Top Articles
1
Dragon Leong blog
2
Stock Market Enthusiast
Feng Shui Market Outlook for FBM KLCI in the Year of the Wood Snake (2025)
3
Stock Market Enthusiast
3 Resilient Stocks That Defied Malaysia’s Market Slump in January 2025 - #GCB, #ABMB, #CDB
4
The Alpha Trader
5
Kenanga Research & Investment
Oil & Gas - Dissecting Petronas and Trump's Impact on the Sector (OVERWEIGHT)
6
Rakuten Trade Research Reports
7
TA Sector Research
8
MQ Market Updates
#
Stock
Score
Daily Stocks
Stock Name
Last
Change
Volume
Stock Name
Last
Change
Volume
Stock Name
Last
Change
Volume
Featured Advertisers / Partners


Ride The Bull Short The Bear
CS Tan
4.9 / 5.0
This book is the result of the author's many years of experience and observation throughout his 26 years in the stockbroking industry. It was written for general public to learn to invest based on facts and not on fantasies or hearsay....