KLCI Index Update 23 Jan 2025
DividendGuy67
Publish date: Thu, 23 Jan 2025, 07:59 PM
Background
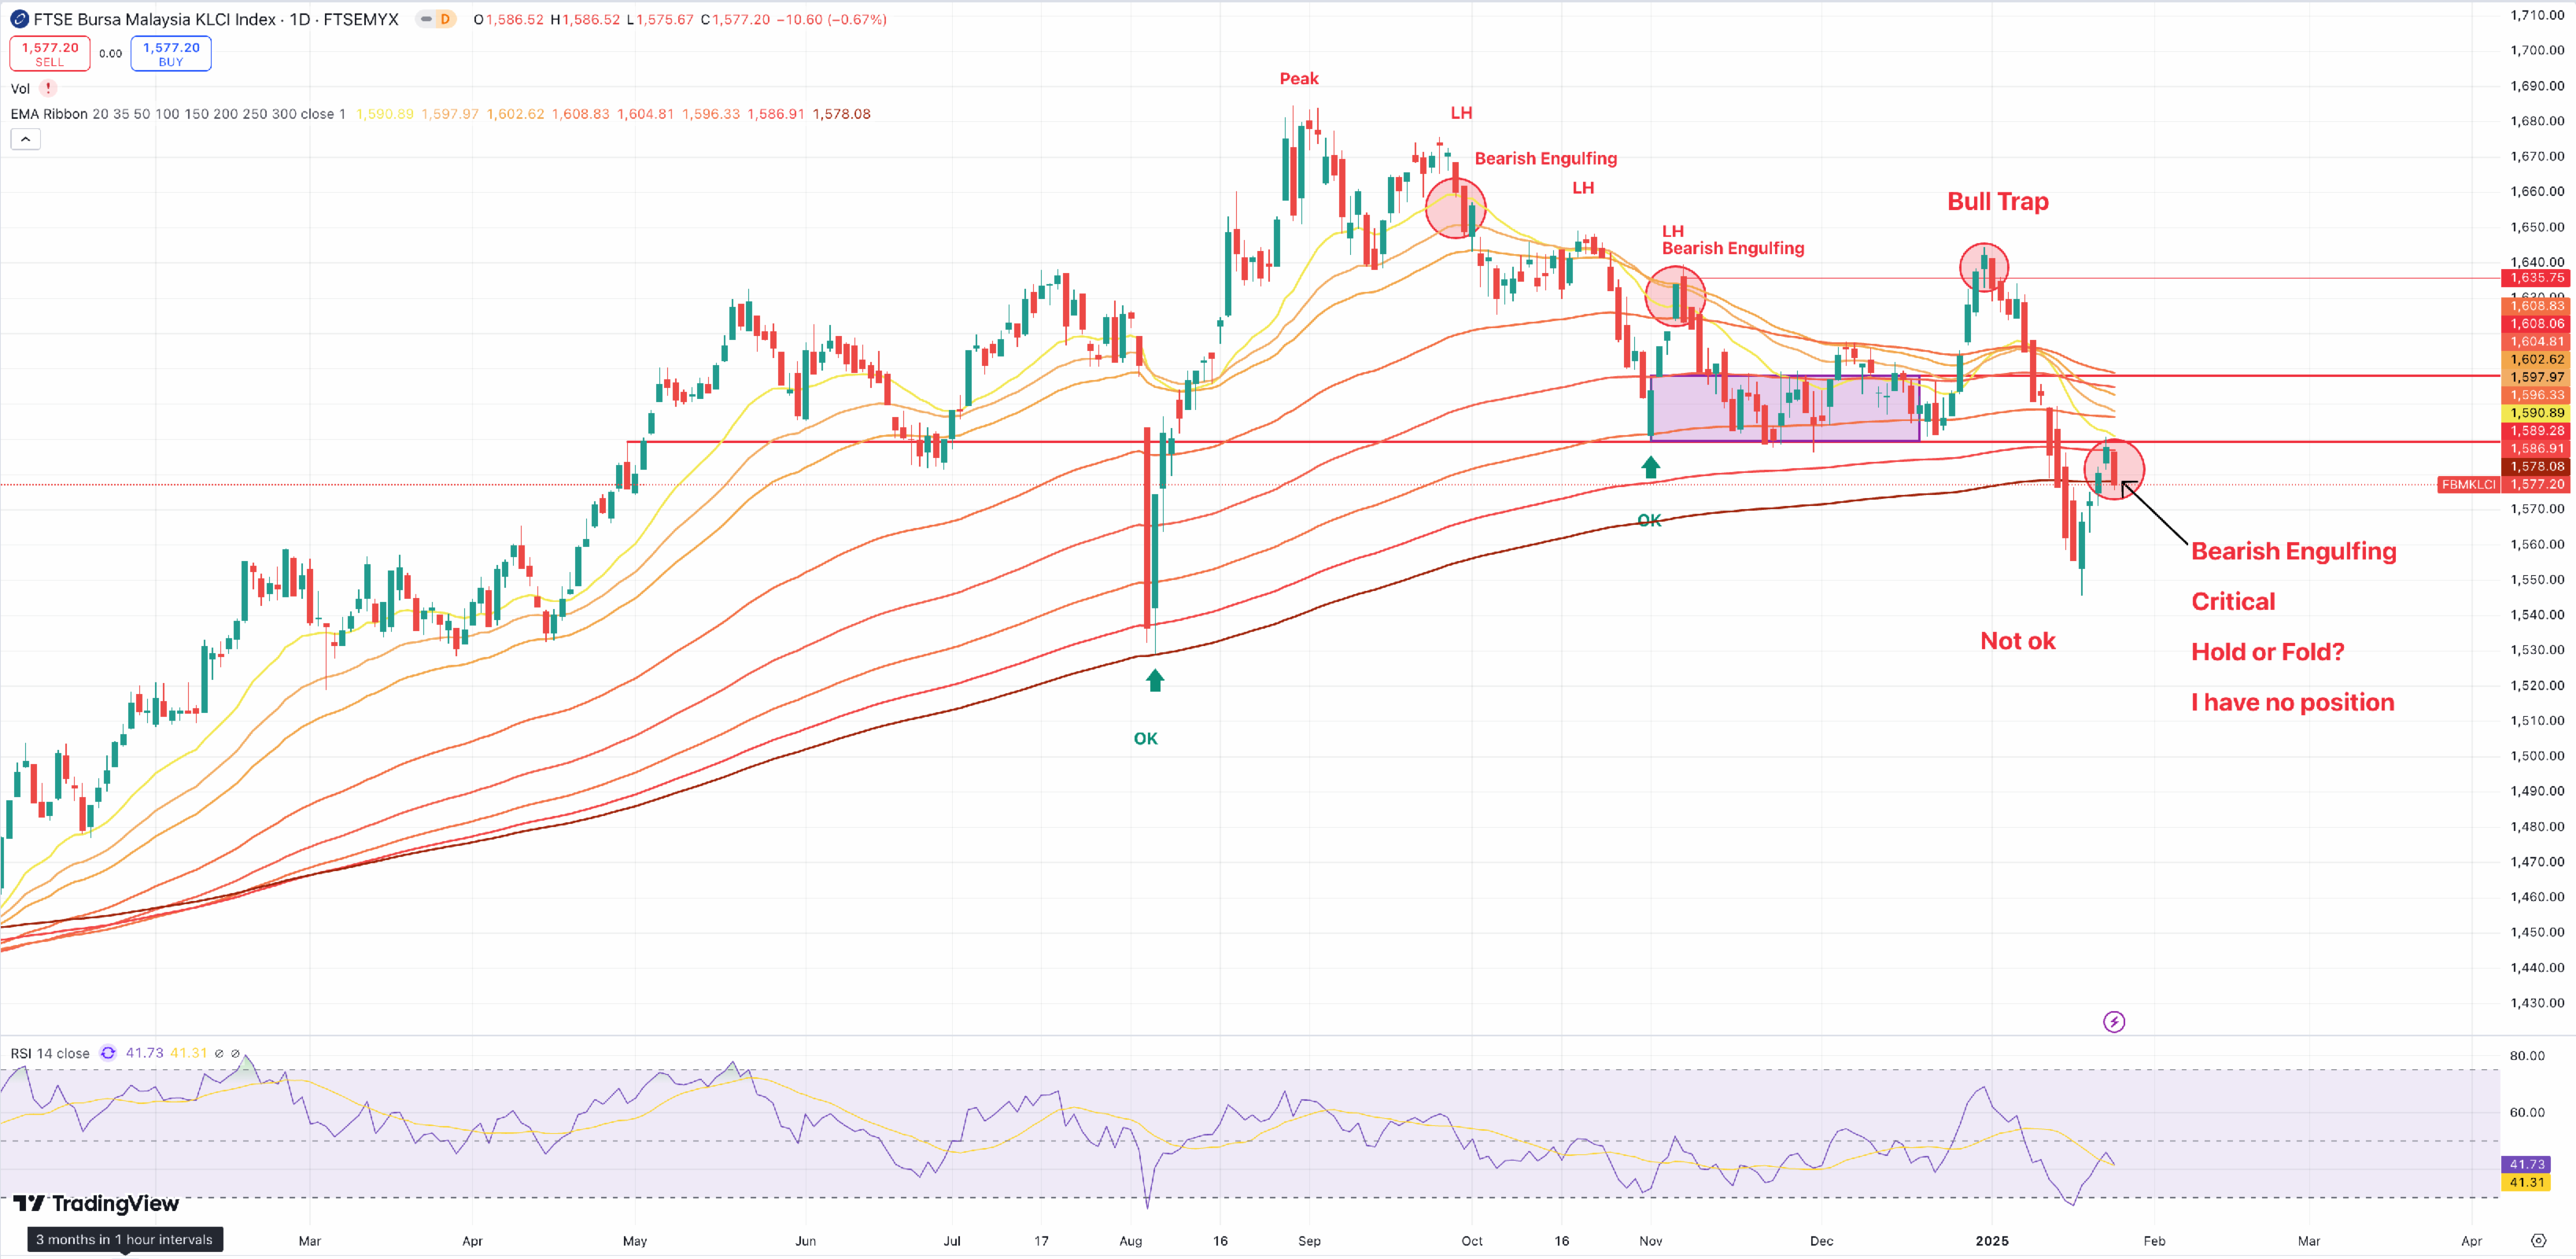
Today, the KLCI index closed -0.67% with a Bearish Engulfing candle near the top of an attempt to "swing up", after breaking below and above the 200dEMA.
Chart wise, a Bearish Engulfing is a bearish trend reversal candlestick pattern.
Historically, when we see Bearish Engulfing the near swing top, it suggests that participants are leaving which sometimes mark the swing top. However, market sentiments are "moody" and "fickled" but the absence of support is not a good sign for the bulls, loosely speaking.
The situation looks critical.
Should those who has not yet left "Hold", or "Fold"?
Today's Daily Candle Chart

As I write this, the US pre-market is also in slight red, so, maybe the KLCI close might have anticipated a weakening in the US markets although the size in the US pre-market is relative smaller than 0.67%.
0.67% is not a large move and typically reflects doubts in the markets on next moves. However, the potential to escallate cannot be dismissed.
Price now sits on important 300dEMA, previously acting as rapid bounce for the August 2024 fast correction.
It needs to bounce back up tomorrow for the Bulls to defend the KLCI, else the recent Bull Bull Trap at the start of the year, coupled with the series of lower highs since Sep peak does not bode well for the near term outlook for KLCI and Malaysia stock market.
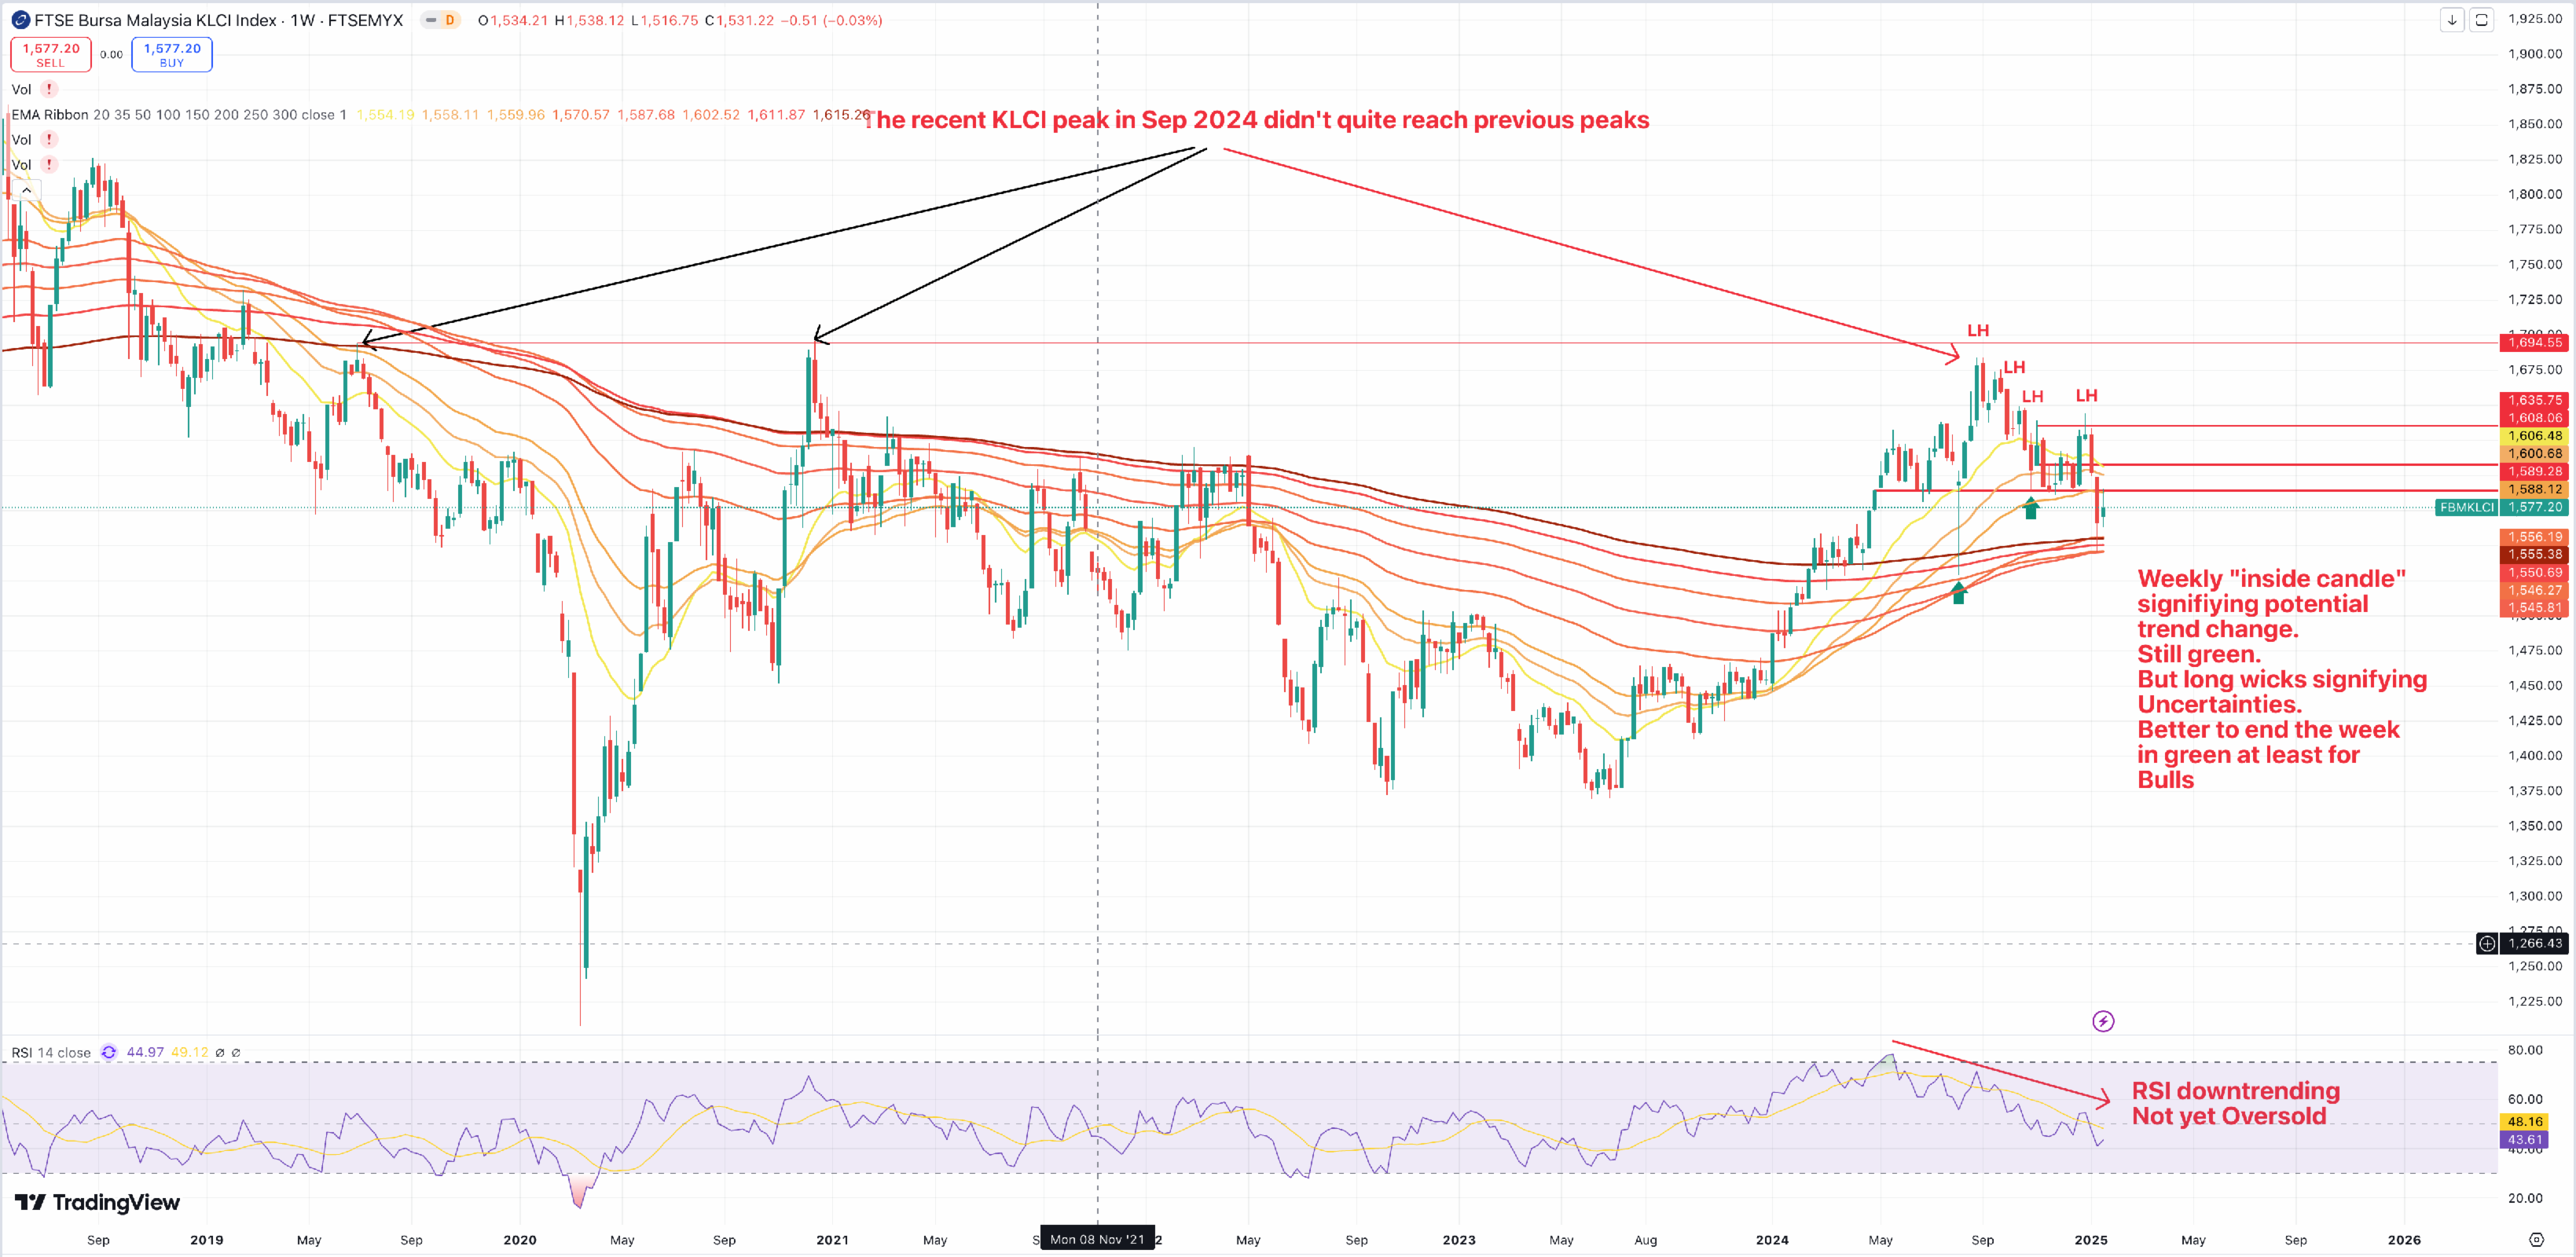
Today's Weekly Chart

Weekly chart is more positive, signifying reversion to test previous Support when it spent weeks around the 300week EMA.
If it wants to retest this previous EMA support, then, it is possible to spend the next week or next several weeks to retest this. Ideally, bulls want to see a fast rebound, if retest this. Still part of the trend change since mid 2023 bottom.
Weekly RSI is still not quite oversold. Historically, when Weekly RSI is oversold, it is not a bad time to buy the Dip for longer term traders and investors, provided the bottom is seen. An example is early 2020 during the Covid bottom, when Weekly RSI was flashing red and Oversold. The subsequent moves up is very nice.
Summary and Conclusion
Everyone's situation is different, so, everyone's conclusion can be different.
I already reduced substantially my positions in Bursa Malaysia before and after September 2024 peak, further reduced in Oct 2024, and no positions left since mid Nov 2024. So, I'm looking at the charts here only because I know people who are still invested in Bursa Malaysia, in real life and the Internet. And we never know if we might find opportunities during bear market bottoms - who knows.
On daily chart, KLCI looks like it's on a critical juncture, with the bearish engulfing. Not nice for longs.
On weekly chart, unfortunately, the Weekly RSI is not yet oversold like it was during Mar 2020 low. However, the way the EMA ribborns curled upwards since mid 2023 bottom is still hopeful for Bulls and investors and so, should not be written off yet. However, the Index may want to retest the 300 week EMA like it did when it consolidated near there for weeks back in early 2024, so, if the retest happens, it suggests potentially slightly further lower prices for several weeks to come. Ideally, bulls will want any retest to be brief, short and strong, but that depends on Mr Market and not anybody's "hope".
Trade safely.
Disclaimer
- Not a Financial Advice.
- Only a Random Guy on the Internet.
- You are fully responsible for your own Trading and Investing positions.
More articles on https://dividendguy67.blogspot.com
Created by DividendGuy67 | Jan 22, 2025


