


HumbledInvestor
[Humbled Investor] Careplus - Actual performance that exceeded market expectation

HumbledInvestor
Publish date: Sun, 25 Oct 2020, 09:12 PM
[Careplus - Actual performance that exceeded market expectation]
Join our free telegram channel: https://t.me/humbledinvestordiscussion
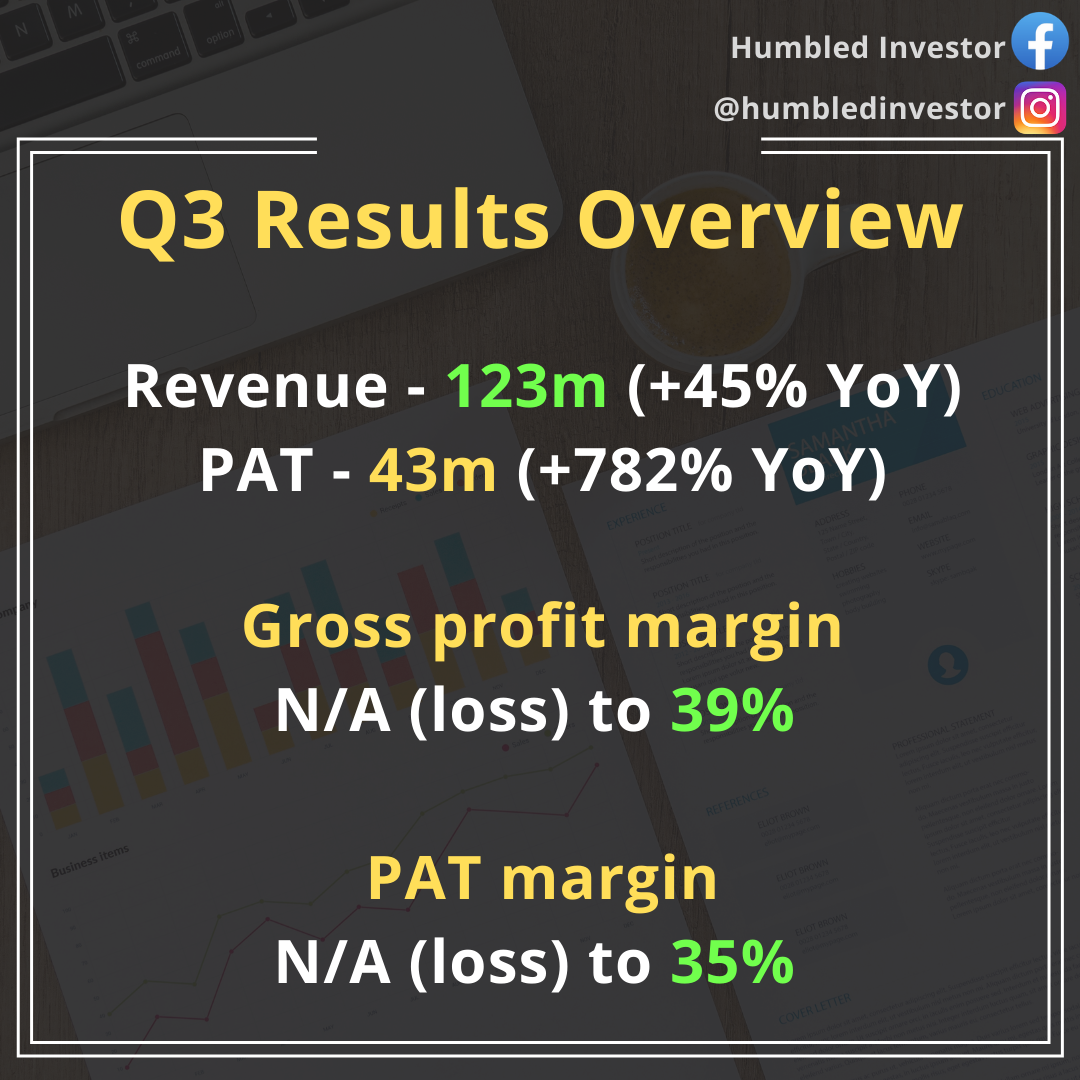
Revenue – RM123m (+45% YoY)
PAT – RM43m (+782% YoY)
Gross profit margin – 39%
PAT margin – 35%
Careplus Group has delivered stellar performance in Q3 2020 with historical high revenue and net profit ever achieved. This is beyond our expectation given that Careplus Group has sold 50% stake of its wholly owned subsidiary to Ansell.
Higher sales quantity, higher selling price, higher utilization rate and better capacity output leads to higher gloves sales in Q3 2020. If we look at the operation margin by comparing the preceding quarter, the EBITDA margin has increased from 23% to 38%, representing a surge of 15 percentage points which are due to better production efficiencies. This eventually also shows that the next quarter results for the comparable companies is expected to be as high as Careplus Group, and even higher expectation will be placed on the Big 4 in gloves sectors given their bigger market shares which are able to take on more orders at lower costs as a result of economies of scales.
But are there any one-off items to the Careplus Group’s results this quarter? In Q3 2020, the result was way beyond our expectations. Before we drilled into the actual performance of Careplus Group in Q3 2020, let’s go through the background of Careplus Group recent JV story.
Corporate Strategy
In May 2020, Careplus Group has entered into a JV agreement via the disposal of 50% stake in Careplus M to Ansell for RM27mil. This JV would result in Careplus Group losing control over Careplus M as wholly owned subsidiary and become a 50:50 joint venture company in Careplus Group.
The purchase consideration of RM27mil derived from “1.5x * 50% * Net assets” eventually indicating that Ansell is paying 75% of Careplus M’s net assets for 50% stake due to the 1.5x of net assets multiples (“NA multiples”).
The NA multiples of 1.5x has taken into consideration the trading multiples of other public listed comparable companies in Malaysia which operate in the same business segment as Careplus Group whose principal business activities are generated from the manufacturing of rubber gloves (“Comparable Companies”).
|
No. |
Comparable Companies |
Audited net assets (RM'000) |
Market cap as at 31 Dec 2019 (RM'000) |
Price to book ratio (x) |
|
1 |
Comfort Gloves Berhad |
277,856 |
460,530 |
1.66 |
|
2 |
HLT Global Berhad |
47,900 |
92,156 |
1.92 |
|
3 |
Rubberex Corporation (M) Berhad |
214,454 |
136,094 |
0.63 |
|
4 |
Supermax Corporation Berhad |
1,123,710 |
1,807,169 |
1.61 |
|
|
|
|
Average |
1.46 |
As you can see, the NA multiples of 1.5x is within the low and high range and is close to the average P/B ratio of 1.46x which are computed based on the market capitalization as at 31 December 2019 and audited net assets as at 31 December 2018. If we were to compare against the lastest net assets and latest market capitalization, the NA multiples computed to be 10.4x (as shown below). In essence, we can deduce that the disposal of Careplus M favours more to Ansell rather than Careplus Group as Ansell is paying lesser compared to the current situation where the demand for gloves has never been so high before.
|
No. |
Comparable Companies |
Latest net assets (RM'000) |
Market cap as at 25 Oct 2020 (RM'000) |
Price to book ratio (x) |
|
1 |
Comfort Gloves Berhad |
369,830 |
2,506,681 |
6.78 |
|
2 |
HLT Global Berhad |
82,822 |
981,088 |
11.85 |
|
3 |
Rubberex Corporation (M) Berhad |
269,220 |
1,989,149 |
7.39 |
|
4 |
Supermax Corporation Berhad |
1,608,423 |
25,214,400 |
15.68 |
|
|
|
|
Average |
10.42 |
From this disposal, Careplus Group would generate a cash inflow of RM27mil which is to be utilized as follows:
|
Descriptions |
Proceeds (RM’000) |
% |
|
Careplus M subscription |
10,500 |
39% |
|
Capex |
10,000 |
37% |
|
Working capital |
6,209 |
23% |
|
Total |
26,709 |
100% |
The Careplus M subscription of RM10.5mil by Careplus Group will be discussed below as this involved another capital injection by Ansell of the same amount into Careplus M.
The capital expenditure of RM10mil will be used to increase Careplus Group’s annual installed capacity from 4.14 billion pieces (as at 31 Dec 2019) to 4.62 billion pieces. But are they (Careplus Group) doing the right decision to dispose the 50% stake?
Of course, the benefits of this disposal transaction to Careplus Group are as such:
-
Extra cash for expansion by way of capex to introduce more production lines
-
An opportunity to build a strategic alliance with Ansell Group, which is a global conglomerate involved in manufacturing of surgical and examination gloves and healthcare safety devices (able to leverage on Ansell Group’s market experience, knowledge and business alliances in the glove manufacturing industry)
-
Able to grow the global portfolio of Careplus Group and increase market reach where Ansell group operates
Besides the disposal, another shareholders agreement was entered between both parties which includes a further subscription of new Careplus M shares in equal proportions at a collective consideration of RM21mil.
The JV company, Careplus M would have received RM10.5mil each (a total of RM21mil) from both Ansell and Careplus Group which are mainly used to partially settle the debts owing by Careplus M to Careplus Group.
Capital injection of RM21mil in Careplus M will be used as follows:
|
Descriptions |
Proceeds (RM’000) |
% |
|
Settling interco transactions |
12,000 |
57% |
|
Capex |
9,000 |
43% |
|
Total |
21,000 |
100% |
Besides, 10% private placement has been announced in June 2020 whereby Careplus Group will raise new proceeds of RM11.43mil for capex expansion plans.
Financial Analysis
After the interco settlement, the liabilities would reduce and Careplus M would be ready for the new expansion ahead given their strong historical financials.
|
Financial Year |
2016 |
2017 |
2018 |
2019 |
2020 |
|
|
No. of months |
12M |
12M |
12M |
12M |
9M |
12M Extrapolated |
|
Careplus M |
RM'000 |
RM'000 |
RM'000 |
RM'000 |
RM'000 |
RM'000 |
|
Revenue |
64,849 |
104,745 |
123,967 |
157,086 |
137,855 |
183,807 |
|
PAT |
(8,299) |
(7,047) |
(6,308) |
(1,849) |
12,606 |
16,808 |
|
PAT margin (%) |
-13% |
-7% |
-5% |
-1% |
9% |
9% |
From the table above, we can see that the historical net profit margin of Careplus M is improving. This is mainly due to the increase in production capacity arising from commissioning of new production lines.
To be more accurate in the financial performance analysis, let’s breakdown further the performance of Careplus M in FY2020 (during Covid times).
Careplus M – Joint Venture
|
Percentages of shareholdings |
100% |
50% |
|
|||
|
No. of months |
Period |
Revenue (RM’000) |
Expenses (RM’000) |
Profit (RM’000) |
Profit (RM’000) |
Profit margin (%) |
|
4.5 |
1 January - 14 May 2020 |
63,000 |
(60,900) |
2,100 |
N/A |
3% |
|
1.5 |
15 May - 30 June 2020 |
25,596 |
(23,824) |
1,772 |
886 |
7% |
|
3 |
1 July - 30 Sept 2020 |
49,259 |
(40,525) |
8,734 |
4,367 |
18% |
|
|
Total |
74,855 |
(64,349) |
10,506 |
5,253 |
14% |
From the analysis above, we can notice that the profit margin has actually increase exponentially during the last quarter from July to September 2020, achieving 18% net profit margin.
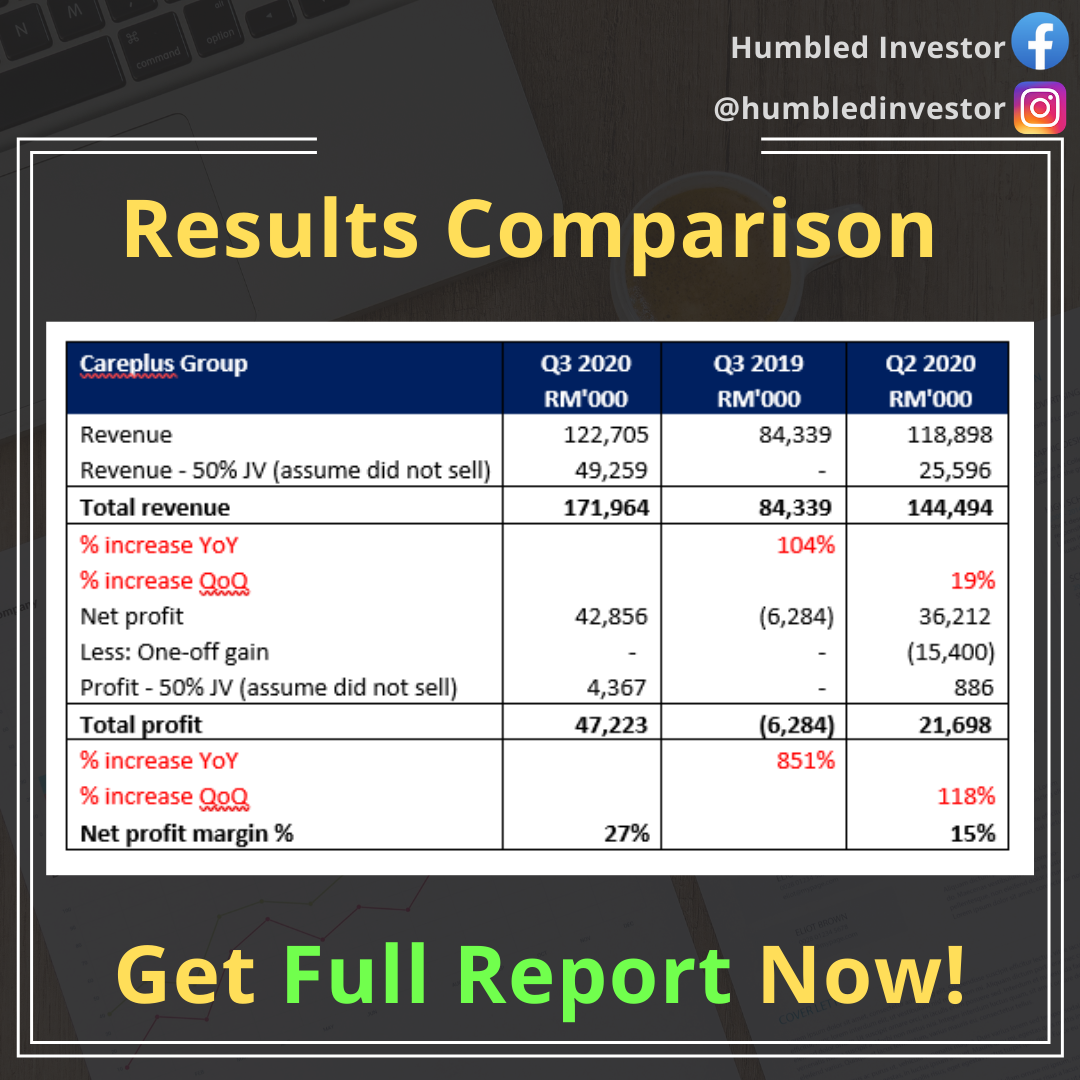
To compare like-to-like, assuming Careplus Group did not sell 50% stake in Careplus M to Ansell, the revenue would have actually increased by 104% YoY instead of 45% YoY and the net profit would have actually boosted by 851% YoY instead of 782% YoY.
Comparing to preceding quarter, if Careplus Group did not sell 50% stake in Careplus M to Ansell, total revenue would have increased by 19% YoY instead of 3% YoY and the net normalized profit would have increased by 118% YoY instead of 106% YoY. The comparison is shown in the figure below.
|
Careplus Group |
|
Q3 2020 |
Q3 2019 |
Q2 2020 |
|
|
|
RM'000 |
RM'000 |
RM'000 |
|
Revenue |
|
122,705 |
84,339 |
118,898 |
|
Revenue - 100% Careplus M (assume did not sell) |
49,259 |
- |
25,596 |
|
|
Total revenue |
|
171,964 |
84,339 |
144,494 |
|
% increase YoY |
|
|
104% |
|
|
% increase QoQ |
|
|
|
19% |
|
Net profit |
|
42,856 |
(6,284) |
36,212 |
|
Less: One-off gain |
- |
- |
(15,400) |
|
|
Profit - 50% JV (assume did not sell) |
4,367 |
- |
886 |
|
|
Total profit |
|
47,223 |
(6,284) |
21,698 |
|
% increase YoY |
|
|
851% |
|
|
% increase QoQ |
|
|
|
118% |
|
Net profit margin % |
27% |
|
15% |
|
Conclusion
The BIG question left, is whether Careplus Group can continue to grow QoQ? It is hard to gauge the supply and demand for gloves, but what we can see is that all gloves companies are expanding their capacity which will then increase the market supply. If the demand could not catch up, demand supply imbalance will result in price competition in order to lower down inventory level for respective companies.
We can observe that the production capacity of Careplus Group has increased from 4.14 billion pieces in Q3 2019 to 4.62 billion pieces of gloves in Q3 2020, an increase of 12% YoY. The demand for gloves is definitely more than 12% comparing year-on-year. Before the supply of additional 4 and 15 production lines kick in by end of 2020 and 2021 which will increase the annual capacity to 10.5 billion gloves (an increase of 127% in the span of 1.5 years), we believe the next quarter results would still be able to deliver a YoY and QoQ growth (given the third wave of Covid-19 situation) albeit at a slower pace.
But bear in mind that share price nowadays is moving 6 months ahead of results and lucrative business will always attract competition. With vaccine expected to be available by early next year, the demand for glove may peak by end of this year. Hence, the upside may be limited with the potential huge supply coming into the market.
____________________________________________________________________________________
All information provided here should be treated for informational and educational purposes only. It is solely reflecting author's personal views and the author should not be held liable for any actions taken in reliance on information contained herein. No buy call. No sell call. No bullshit. Only content.
If you think the article / information is useful to you and you want to learn more, you are welcomed to join our FREE telegram channel @Humbled Investor Discussion or t.me/humbledinvestordiscussion.
This article was written on 25.10.2020.
https://t.me/humbledinvestordiscussion
https://t.me/humbledinvestordiscussion
https://t.me/humbledinvestordiscussion


Related Stocks
| Chart | Stock Name | Last | Change | Volume |
|---|
Market Buzz
More articles on HumbledInvestor
[Humbled Investor] Turnaround story – Scope Industries Berhad
Created by HumbledInvestor | Mar 21, 2021
[Humbled Investor] SCH Group Berhad ("Hextar Industries Berhad")
Created by HumbledInvestor | Mar 07, 2021
[Humbled Investor] Weekly Discussion: JCY, Kobay, PIE, MMSV, VIS, Semiconductor industry
Created by HumbledInvestor | Jan 17, 2021
[Humbled Investor] The 2 most competitive EV makers in near future
Created by HumbledInvestor | Jan 08, 2021
Featured Posts


Latest Videos


MQ Trading Signals
Time
Signal
Duration
Type
2024-08-07 16:30:00
EMA 5
30 Mins
SELL
2024-08-07 16:20:00
ADX
5 Mins
SELL
2024-08-07 15:10:00
EMA 5
10 Mins
SELL
2024-08-07 15:10:00
EMA 5
5 Mins
SELL
2024-08-07 15:00:00
EMA 5
Hourly
SELL
Apps


Top Articles
1
CEO Morning Brief
2
ombak
3
Genetec - A baby step
4
6
CEO Morning Brief
Nearly 8 Mil Cape EMS Shares Traded Off-market Amid Selling Pressure
7
8
CEO Morning Brief
#
Stock
Score
Daily Stocks
Stock Name
Last
Change
Volume
Stock Name
Last
Change
Volume
Stock Name
Last
Change
Volume
Featured Advertisers / Partners


Ride The Bull Short The Bear
CS Tan
4.9 / 5.0
This book is the result of the author's many years of experience and observation throughout his 26 years in the stockbroking industry. It was written for general public to learn to invest based on facts and not on fantasies or hearsay....
VenFx
Big like
2020-10-25 21:46