


Intelligent Investing
An Analysis on Lafarge

Background
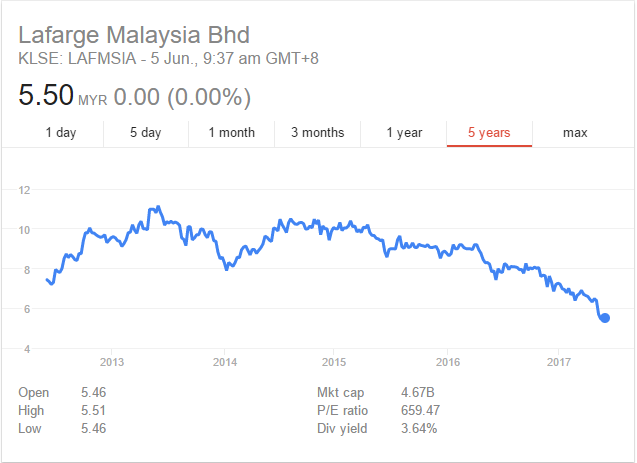
Malaysia’s cement industry is getting hit hard over the past few years. Lafarge, the biggest cement player in Malaysia is down close to 50% from its peak $10 in 2015. The 4 key factors currently affecting the cement industry are:
Industry headwinds
-
Higher cost
-
Overcapacity
-
Soft property market
-
Slow rollout of infrastructure projects
Higher cost
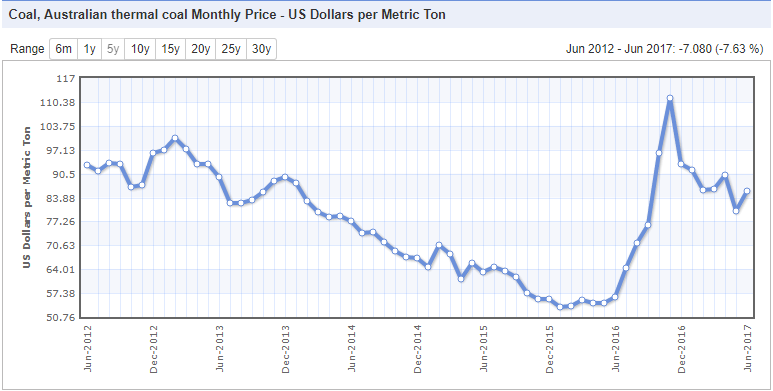
Energy cost makes up 30-40% of the total cost for most cement players. As a result of higher coal price since last year, higher electricity tariff and transportation cost, these factors are putting a big pressure on Lafarge’s gross margin. Typically cement players secured a 50-100% of their coal price on a yearly contract, therefore the coal price hike in 2016 will get reflected this year.
Overcapacity
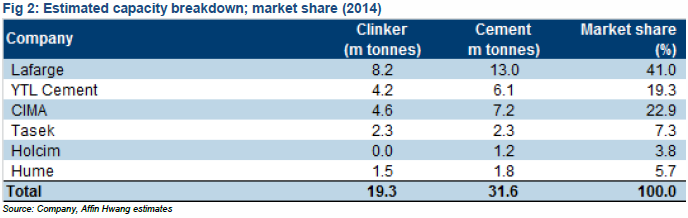
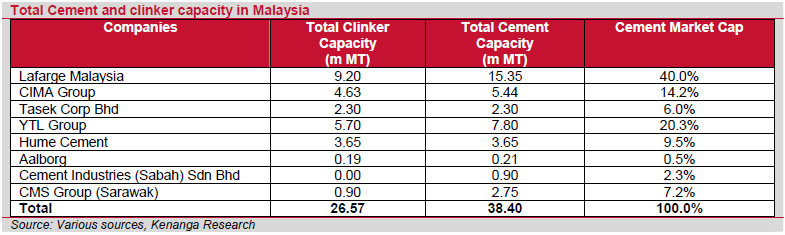
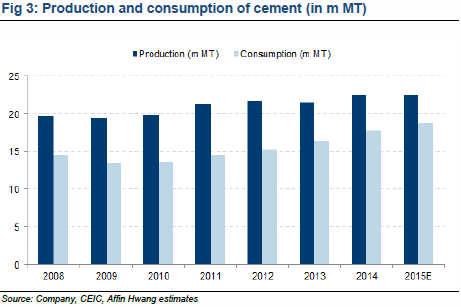
Back in 2014-15, a few players (Lafarge, Hume & YTL) decided to increase capacity and as a result, total cement production capacity has gone up by 21%+/- over the past 3 years from 31.6mil MT (metric tons) to 38.4mil MT. Considering cement consumption only grows at around 3-4% on average in the long-term, that is massive. Cement consumption this year is estimated to be around 20 mil MT vs 34 mil MT capacity (cement production doesn’t go to 100% utilization), that is around 59% utilization level, lower than the average of 70%. As a result of oversupply and to maintain market share, cement players started offering price rebate and the price war ensued. So the pricing pressure and cost hike are supply side problems.
Soft property market
Now the demand side challenges. To make matter worse, the property market started to slow in 2015 and since then it has yet to pick up. Generally, the infrastructure, residential and commercial market each makeup one-third (⅓) of cement consumption. So that’s another big hit. No one knows when the residential property market will recover. Even the experts disagree amongst themselves.
Slow rollout on infrastructure projects
Although the construction industry is all the buzz right now, most of the ongoing infrastructure projects i.e MRT line 1 are on their tail end and big projects awarded in 2016 i.e MRT line 2, SUKE and DASH are in the preliminary stage.
Company specifics
Lafarge has their own challenges as well. There is ongoing integration cost since Lafarge acquired Holcim in 2015. The acquisition also increased their borrowings and interest expense, putting more pressure on profit margin.
With production cost remain elevated, oversupply condition is unlikely to ease anytime soon while a weak property market further exacerbates the entire situation, there’s no surprise that Lafarge’s share price has reached a 7 years low. There doesn't seem to be anything to see here given there’s no light at the end of the tunnel.
Or maybe there is?
History of cement price and industry
To give you a background, the history of cement price can be broadly divided into 3 stages.
|
Timeline |
Pricing Method |
Notes |
|
1995 - Dec 2006 |
Ceiling price |
A price ceiling of RM198 per MT enforced by Malaysia gov. |
|
2007 - May 2008 |
Ceiling price |
Ceiling price revises upward 10% to RM218 per MT. 40% cost increase over the past decade. |
|
June 2008 - Present |
Auto Pricing |
Liberalisation of cement sector. Implementation of the auto pricing mechanism. The supply and demand of the market dictate price. |
And here are some historical significance but I’ll focus more on the price war. The timeline is approximate.
|
Timeline |
Events |
|
2004 |
Slowdown in construction sector due to constraint in supply of steel bars & excess cement capacities increased price rebate as manufacturers compete to maintain market share. |
|
2005 |
Completion of large infrastructure projects, deferment of major projects dampened demand and exacerbate oversupply situation. |
|
Rebate pricing reaching all time high of RM82 per MT compare to RM21 per MT in 2004. Bulk cement price averaging RM166 per MT. It is believed YTL Cement started the war to gain a bigger slice of the pie after an expansion. Lafarge decided to play ball while Tasek refused. |
|
|
YTL Cement Francis Yeoh - "We have kept the Malaysian cement industry competitive by our efforts. The prices of Asean cement, on average, is 25% higher than those of Malaysian cement..." |
|
|
“Competition can be intense...and prices may then go down as some competitors think that they will be able to take advantage of these circumstances to gain market share...we have no choice but to support our customers and defend our market position. We think that, after some time, our competitors will understand that they will not grow their market share through price wars and will look at the interest of the whole construction industry.” - Lafarge |
|
|
Teo - “Tasek has no part in it (the price war)...unlike the other players, we have no borrowings. We are prepared to fight, but we're not sinking to a price war. Let's see who has staying power.” |
|
|
2006 |
Overcapacity and price war continues. Cost of production increased i.e coal, fuel prices. |
|
2007 - 2008 |
Introduction of auto pricing mechanism in 2008 and industry consolidation stabilized price and reduce the risk of another price war. Average price RM220 per MT. |
|
2011 |
Increased in sales volume and selling price unable to offset a sharp increase in fuel and energy cost. |
|
2014 - 2016 |
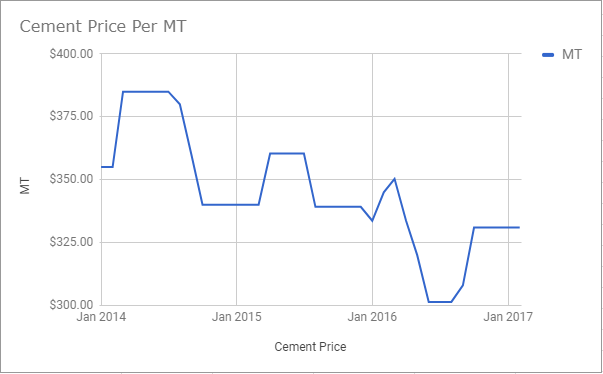
Increased capacity from YTL, Lafarge and Hume's entry contribute to an oversupply situation. Slow property market and delay in infra projects exacerbate the situation. Average price went down from RM370 per MT to RM300 MT during this period (exclude rebate). |
What does this all means?
When you go through the history over the past 15 years or longer, the price war is part of life. Cement is a cyclical industry. You see major wars in 2004, 2005, another in 2009 followed by 2011 and 2014 until now with many mini battles in between. The reasons for price wars vary from time to time, but it always revolves around a few key triggers such as weak demand, increases capacity, over supply, cost increase and competitions. This time is no different. A combination of factors listed above contributed to the current situation. Here we are relying on past pattern as a guide to forecast the future.
First, I’m going to ignore the property market and coal price factors. I have no idea where they will be this year, next year or the year after so I won’t go into predicting the unpredictable. Another reason I’m not too concern about coal price is that it is nothing new to Lafarge. They will adapt just like all other times in the past 60 years doing business in Malaysia unless I missed something. The slow rollout of infrastructure projects is a timing issue so I’ll leave that out as well. The only key driver I’ll focus on is overcapacity. That’s also the only thing cement players have control on.
A few reasons I believe the overcapacity situation will recover, although I’ve no idea when.
No capacity increase in the near term
There is news that cement players are unlikely to increase their capacity over the next few year but that’s definitely something hard to predict because it is a psychological thing. If you look at global shipping industry which is facing serious oversupply condition right now, some players continue to put in orders to build new ships so when the recovery comes, they will be way ahead of others. However, it will never recover if all the players collectively think and behave in this way. So it is psychological.
No. of players
But I believe these cement players can get it right. Unlike global shipping industry which consists of thousands of players making it hard to coordinate and cooperate, 90% of the cement capacity falls under 4-5 players. Yes, there has been some market share grabbing, in particular, Hume (they are getting killed too) but generally, when there are fewer players in the field, it is easier to cooperate and work together. An oligopoly market is easier to coordinate than a fragmented market.
New entrant & Market shares
Another factor is new entrant. The industry has not seen any new players coming in so this makes it easier for existing players to cooperate and stabilize market share. Over the past 10 years, market shares for all the existing players have remained somewhat unchanged. Although this is far from saying there is a barrier of entry (less susceptible to imported cement due to high transportation cost), it is nonetheless a positive sign that the players can sort it out themselves in due time.
Exports
Most players are also putting more effort on exporting their cement overseas due to the local oversupply situation. In particular, YTL focusing on Singapore market and Lafarge exporting into Asian markets as Japan stops their export to gear up for Olympics construction.
One thing that these players are unlikely to do is reducing capacity via plant shutdown so capacity reduction will only happen when existing plants become old and inefficient. Hence, even if these players decide to play nice going forward, it will need a lot of help from the demand side.
Earning power
The next thing is to examine Lafarge’s earning power. We want to know how much Lafarge can make in a normal condition. The starting point is revenue. We need to know 3 things. 1) Capacity/Volume 2) Utilization rate 3) Selling price. All the figures are public.
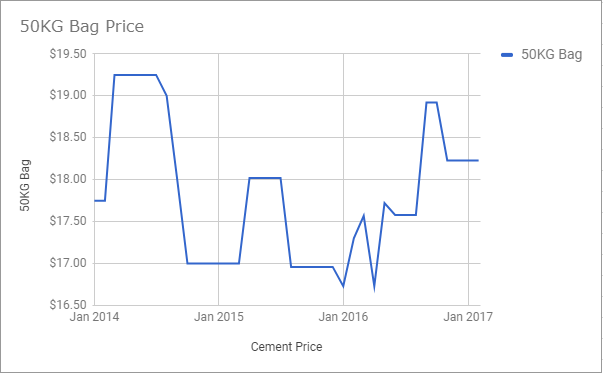
Lafarge’s current capacity sits at 15.3+/- mil metric tons post acquisition. Historical industry utilization rate sits at around 70%, but currently, it is likely to sit at somewhere 60%. Retail selling price sits at RM16.5/50kg bag (RM330 per MT), so for wholesale, they are likely to be around RM15+/- (RM300 per MT). Data from CIDB also points to this price range at the current market condition. These average selling price (ASP) are prior to price rebates.
Source: CIDB
Now we can be quite certain with the capacity and utilization numbers, but how can we possibly know the normalized price per MT? The fact is we don’t. The good thing is we don’t need an exact price, but one that is reasonable to make a guesstimate. Here I’ll use 3 things as my reference points. They are far from perfect but should give us an idea.
Historical price
When auto pricing mechanism is introduced in 2008, the ceiling price was RM218 per MT. And considering that was the cement price 9 years ago, factoring in inflation, more or less similar coal price per ton, higher labor and electricity cost, it is safe to use RM220 per MT as the floor. Means it is not quite possible for current cement price to go below that price in the long-term.
Current price
Based on CIDB data, over the past 3 years the lowest point is around RM300 per MT in mid-2016. That is a good reference point if we consider that price war began 3 years prior to that (2014), future ASP can go even lower but there’s a valid point to think RM300 is close to the trough in industry cycle.
Production cost
In the long-term, ASP per MT cannot fall below its production cost. But this is also the hardest to estimate (highly inaccurate). The best I can figure is it takes about 200 kg of coal to produce per MT of cement (public info but every cement plant is different), and given the average coal price of USD90 (RM360), it takes about RM72 of coal to produce per MT of cement (RM360/5). Since coal typically makes up about 20-30% of cement manufacturing cost, so full cost is around RM240-360 per MT. Those are a very wide figure.
But by looking at these 3 reference points, we have a rough idea long term earning power should be more than RM240. We will never agree on one ‘right’ number but let’s use RM300 because it is reasonable.
Now we have the 3 numbers, we can estimate their normalized revenue.
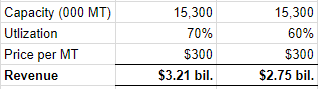
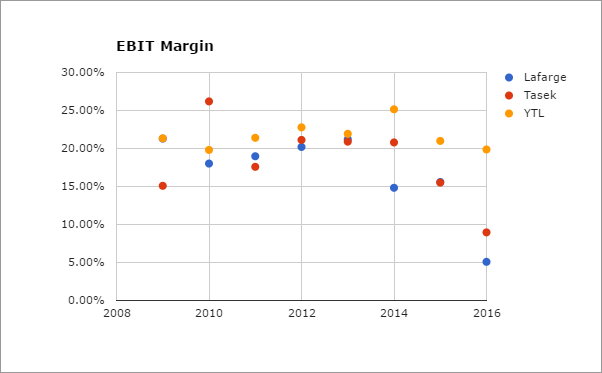
So we have a range of $2.8-3.2 billion in revenue. Their revenue in 2016 is around $2.5 bil. Next, we need to know their margin. When you look at the earnings before interest & tax (EBIT) margin across the 3 main players over the past 7 years, it is sitting at around 20%. CIMA belongs to UEM which is a private company so their figures are not public (only UEM Sunrise is listed).
To be on the safe side, we will give it a 15% EBIT margin, that’s about RM420-480 mil EBIT. Factor in interest expense (20 mil+/-) and 25% tax rate, that’s RM300-345 mil in profit or RM0.36 - 0.41 per share in earning power (850 mil. outstanding). Compare that to the current share price of RM5.50, you are paying about 13-15x for Lafarge, which are quite a good multiples given the track record and quality of the business. Lafarge historical PER sits at 15-25x so it is outside the lower band.
Peer comparison
We can also do some peer comparison but this doesn’t tell you anything about valuation except knowing Lafarge’s current price against its peers.
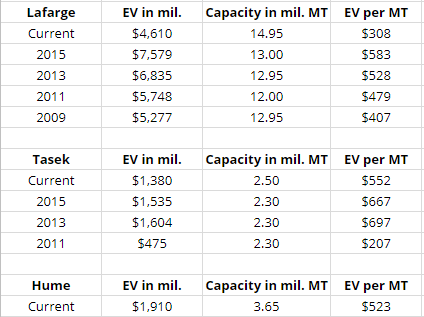
Here, by comparing the enterprise value (EV) of each company to its total capacity, we have an idea how much are we paying to own their full capacity. At the current price, for each ton of capacity, we are paying about RM308 in enterprise value, and compare that to other cement players and historical multiples, it is on the low end.
Dividend valuation
Another way to value Lafarge is to look at their dividend. The cement industry only grows around 3-4% p.a over the long term so Lafarge has been paying out over 90% of their earnings in the past 10 years (93% to be exact). That’s somewhat similar to stocks like Dutch Lady and Nestle. And there’s a reasonable assumption to believe that investors are attracted to Lafarge because of their consistent dividend payout. But since they are cutting their dividend lately, that possibly explain why the share price is coming down hard.
We already have a rough estimate how much Lafarge will earn in a normal condition. And there’s a strong reason to believe they will continue to pay 90% of their earnings going forward. With an earning power of RM0.36-0.41 per share, 90% payout gives us RM0.32-0.37 of dividend per share.
As an investor, how much would you be willing to pay for the stock to accept that amount of dividend? I can put my money in a 10 years government bond or fixed deposits, both would yield me 4%+/- in interest today. So I’ll need Lafarge to offer more than 4% because equities carry a higher risk. Make it 5% dividend yield. Is that reasonable?
Dutch Lady current dividend yield is 3.75% and Nestle 3.3%. Another reference point is when Lafarge is trading at $10 in 2015, the dividend yield is around 3.2%. Investors gladly accepted a dividend yield close to 3% back then. So it is safe to assume 5% is the minimum yield majority of investors are willing to accept (lower yield increase valuation).
If I believe Lafarge will pay out $0.32-0.37 in dividend and the market is happy with a 5% yield, I would value Lafarge at RM6.4-7.4 (RM0.32-0.37/5%). Another way to put it is if you are a dividend investor and you can afford to wait, the current price will give you a dividend yield of 6-7% the least. The current price of $5.50 gives us another 15% margin of safety.
Conclusion
Apart from what’s been discussed, another thing that is staking in our favour is the durability of the business. Lafarge controls 40% share in the cement market, and it is unlikely to ceade that position any time soon. They are also a key supplier for some huge infrastructure projects that rely on their capabilities and experience. On the pricing side, there’s also reason to believe that the downside (a low probability of permanent capital losses in next 3-5 years) is minimal considering most of the negative expectation has been priced in.
In saying that, this investment thesis is built on the assumption that what is happening now is similar to the past. The key risks include our assumptions on Lafarge earning power and favourable supply side dynamic (no further expansion & ability to cope with production cost). There’s also uncertainty (unknown probability) on the demand side dynamic, in particular, the property market. It is critical to setup ‘signpost’ so when any of these assumptions are violated i.e news on increase capex, expansion etc, one would have to reassess this thesis.
If you find this helpful, share it & subscribe to be a better investor.
Related Stocks
| Chart | Stock Name | Last | Change | Volume |
|---|
More articles on Intelligent Investing
Discussions
4 people like this. Showing 2 of 2 comments
But why lose monies, given it is dominant with 40% mkt share leh ?
Raider think something missing in the analysis loh....!!
Need to analyse why larfarge lose monies...and how could it compete in order to make monies with YTL, Tasek, CIMA and Hume loh....!!
2017-07-20 21:27
Post a Comment
Featured Posts
Introducing MY's First IPO Fund for Sophisticated Investors!
New Update. Discover investment communities that resonate with your ideas
M & A Value Partners IPO Equity Fund has been launched - Targeted 13% Return p.a
Latest Videos


Apps


Top Articles
1
Stock Market Enthusiast
Top 3 AI/Data Center Newsflow for the 3rd Week of December - #TENAGA, #YTL, #YTLPOWER
2
Rakuten Trade Research Reports
3
save malaysia!
4
Good Articles to Share
5
Good Articles to Share
6
Good Articles to Share
Gaza ceasefire deal 'closer than ever', says Hamas and two allies
7
Good Articles to Share
Ryan Serhant makes bold pitch to fix the housing ‘affordability crisis’
8
Good Articles to Share
#
Stock
Score
Daily Stocks
Stock Name
Last
Change
Volume
Stock Name
Last
Change
Volume
Stock Name
Last
Change
Volume
Featured Advertisers / Partners


Ride The Bull Short The Bear
CS Tan
4.9 / 5.0
This book is the result of the author's many years of experience and observation throughout his 26 years in the stockbroking industry. It was written for general public to learn to invest based on facts and not on fantasies or hearsay....
TanTeeHean
informative.
2017-07-20 20:41