


WahLau Math
Linear Line VS KLCI Ver.2

From the 1st method http://klse.i3investor.com/blogs/Math/84866.jsp, we draw our line with link the 1st point (1979) with low and high limit. Maybe some of your will get the ideas how about we draw the line by link between low limit, and get the average.
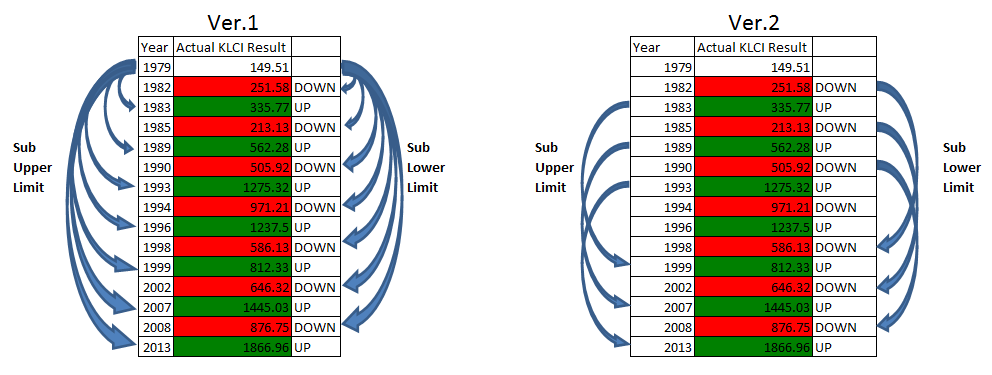
We repeat it to high limit. The result as below:
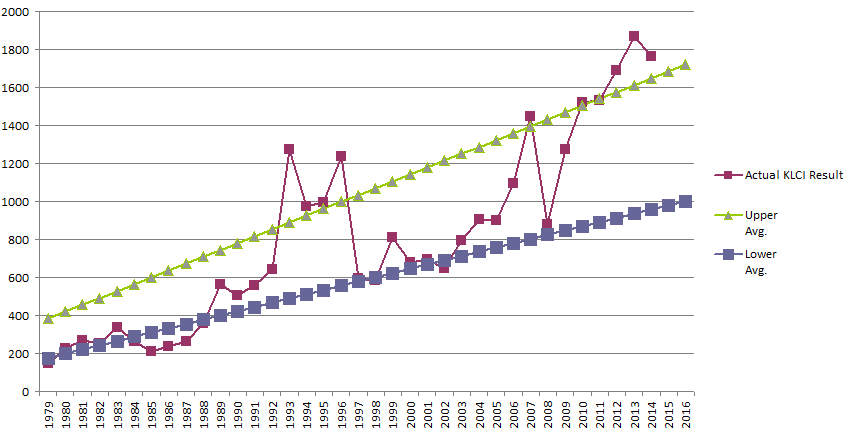
I think me need to slow slow wait for good buying point....=.=
*Just sharing as study case and take your own risk to use it in your investment.
If you intesting to see the data,
| Upper Limit | Lower Limit | |||||||||
| Year |
Actual KLCI Result 1sr Working day Dec |
% |
Foracast 1983 1999 |
Foracast 1989 2007 |
Forecast 1993 2013 |
Upper Avg. |
Forecast 1982 1998 |
Forecast 1985 2002 |
Forecast 1990 2008 |
Lower Avg. |
| 1979 | 149.51 | 216.63 | 71.86 | 861.17 | 383.22 | 188.85 | 60.24 | 279.30 | 176.13 | |
| 1980 | 227.02 | 51.8% | 246.42 | 120.91 | 890.75 | 419.36 | 209.76 | 85.72 | 299.90 | 198.46 |
| 1981 | 268.24 | 18.2% | 276.20 | 169.95 | 920.34 | 455.49 | 230.67 | 111.20 | 320.51 | 220.79 |
| 1982 | 251.58 | -6.2% | 305.99 | 218.99 | 949.92 | 491.63 | 251.58 | 136.68 | 341.11 | 243.12 |
| 1983 | 335.77 | 33.5% | 335.77 | 268.03 | 979.50 | 527.77 | 272.49 | 162.17 | 361.71 | 265.45 |
| 1984 | 265.61 | -20.9% | 365.56 | 317.07 | 1009.08 | 563.90 | 293.40 | 187.65 | 382.31 | 287.79 |
| 1985 | 213.13 | -19.8% | 395.34 | 366.11 | 1038.66 | 600.04 | 314.31 | 213.13 | 402.91 | 310.12 |
| 1986 | 239.05 | 12.2% | 425.13 | 415.16 | 1068.25 | 636.18 | 335.22 | 238.61 | 423.51 | 332.45 |
| 1987 | 261.19 | 9.3% | 454.91 | 464.20 | 1097.83 | 672.31 | 356.13 | 264.09 | 444.12 | 354.78 |
| 1988 | 357.38 | 36.8% | 484.70 | 513.24 | 1127.41 | 708.45 | 377.04 | 289.58 | 464.72 | 377.11 |
| 1989 | 562.28 | 57.3% | 514.48 | 562.28 | 1156.99 | 744.58 | 397.95 | 315.06 | 485.32 | 399.44 |
| 1990 | 505.92 | -10.0% | 544.27 | 611.32 | 1186.57 | 780.72 | 418.86 | 340.54 | 505.92 | 421.77 |
| 1991 | 556.22 | 9.9% | 574.05 | 660.36 | 1216.16 | 816.86 | 439.76 | 366.02 | 526.52 | 444.10 |
| 1992 | 643.96 | 15.8% | 603.84 | 709.41 | 1245.74 | 852.99 | 460.67 | 391.50 | 547.12 | 466.43 |
| 1993 | 1275.32 | 98.0% | 633.62 | 758.45 | 1275.32 | 889.13 | 481.58 | 416.98 | 567.73 | 488.76 |
| 1994 | 971.21 | -23.8% | 663.41 | 807.49 | 1304.90 | 925.27 | 502.49 | 442.47 | 588.33 | 511.10 |
| 1995 | 995.17 | 2.5% | 693.19 | 856.53 | 1334.48 | 961.40 | 523.40 | 467.95 | 608.93 | 533.43 |
| 1996 | 1237.5 | 24.4% | 722.98 | 905.57 | 1364.07 | 997.54 | 544.31 | 493.43 | 629.53 | 555.76 |
| 1997 | 594.44 | -52.0% | 752.76 | 954.61 | 1393.65 | 1033.67 | 565.22 | 518.91 | 650.13 | 578.09 |
| 1998 | 586.13 | -1.4% | 782.55 | 1003.66 | 1423.23 | 1069.81 | 586.13 | 544.39 | 670.73 | 600.42 |
| 1999 | 812.33 | 38.6% | 812.33 | 1052.70 | 1452.81 | 1105.95 | 607.04 | 569.87 | 691.34 | 622.75 |
| 2000 | 679.64 | -16.3% | 842.12 | 1101.74 | 1482.39 | 1142.08 | 627.95 | 595.36 | 711.94 | 645.08 |
| 2001 | 696.09 | 2.4% | 871.90 | 1150.78 | 1511.98 | 1178.22 | 648.86 | 620.84 | 732.54 | 667.41 |
| 2002 | 646.32 | -7.1% | 901.69 | 1199.82 | 1541.56 | 1214.35 | 669.77 | 646.32 | 753.14 | 689.74 |
| 2003 | 793.94 | 22.8% | 931.47 | 1248.86 | 1571.14 | 1250.49 | 690.68 | 671.80 | 773.74 | 712.07 |
| 2004 | 907.43 | 14.3% | 961.26 | 1297.91 | 1600.72 | 1286.63 | 711.59 | 697.28 | 794.34 | 734.40 |
| 2005 | 899.79 | -0.8% | 991.04 | 1346.95 | 1630.30 | 1322.76 | 732.50 | 722.77 | 814.95 | 756.74 |
| 2006 | 1096.24 | 21.8% | 1020.83 | 1395.99 | 1659.89 | 1358.90 | 753.41 | 748.25 | 835.55 | 779.07 |
| 2007 | 1445.03 | 31.8% | 1050.61 | 1445.03 | 1689.47 | 1395.04 | 774.31 | 773.73 | 856.15 | 801.40 |
| 2008 | 876.75 | -39.3% | 1080.40 | 1494.07 | 1719.05 | 1431.17 | 795.22 | 799.21 | 876.75 | 823.73 |
| 2009 | 1272.78 | 45.2% | 1110.18 | 1543.11 | 1748.63 | 1467.31 | 816.13 | 824.69 | 897.35 | 846.06 |
| 2010 | 1519.91 | 19.4% | 1139.97 | 1592.16 | 1778.21 | 1503.44 | 837.04 | 850.17 | 917.95 | 868.39 |
| 2011 | 1530.73 | 0.7% | 1169.75 | 1641.20 | 1807.80 | 1539.58 | 857.95 | 875.66 | 938.56 | 890.72 |
| 2012 | 1688.95 | 10.3% | 1199.54 | 1690.24 | 1837.38 | 1575.72 | 878.86 | 901.14 | 959.16 | 913.05 |
| 2013 | 1866.96 | 10.5% | 1229.32 | 1739.28 | 1866.96 | 1611.85 | 899.77 | 926.62 | 979.76 | 935.38 |
| 2014 | 1761.25 | -5.7% | 1259.11 | 1788.32 | 1896.54 | 1647.99 | 920.68 | 952.10 | 1000.36 | 957.71 |
| 2015 | 1288.89 | 1837.36 | 1926.12 | 1684.13 | 941.59 | 977.58 | 1020.96 | 980.04 | ||
| 2016 | 1318.68 | 1886.41 | 1955.71 | 1720.26 | 962.50 | 1003.06 | 1041.56 | 1002.38 | ||
More articles on WahLau Math
Discussions
Be the first to like this. Showing 0 of 0 comments
Post a Comment
Featured Posts
Introducing MY's First IPO Fund for Sophisticated Investors!
New Update. Discover investment communities that resonate with your ideas
M & A Value Partners IPO Equity Fund has been launched - Targeted 13% Return p.a
Latest Videos


Apps


Top Articles
1
Initial Public Offering (IPO)
2
Kenanga Research & Investment
Technology - Export Restrictions and Tariff Threats (OVERWEIGHT)
3
Mercury Securities Research
4
Good Articles to Share
Tariff policy done well can help grow the economy, GOP senator says
5
RHB Investment Research Reports
6
Mercury Securities Research
7
Good Articles to Share
8
#
Stock
Score
Daily Stocks
Stock Name
Last
Change
Volume
Stock Name
Last
Change
Volume
Stock Name
Last
Change
Volume
MQ Trading Signals
Stock
Time
Signal
Duration
Stock
Time
Signal
Duration
Featured Advertisers / Partners


Ride The Bull Short The Bear
CS Tan
4.9 / 5.0
This book is the result of the author's many years of experience and observation throughout his 26 years in the stockbroking industry. It was written for general public to learn to invest based on facts and not on fantasies or hearsay....