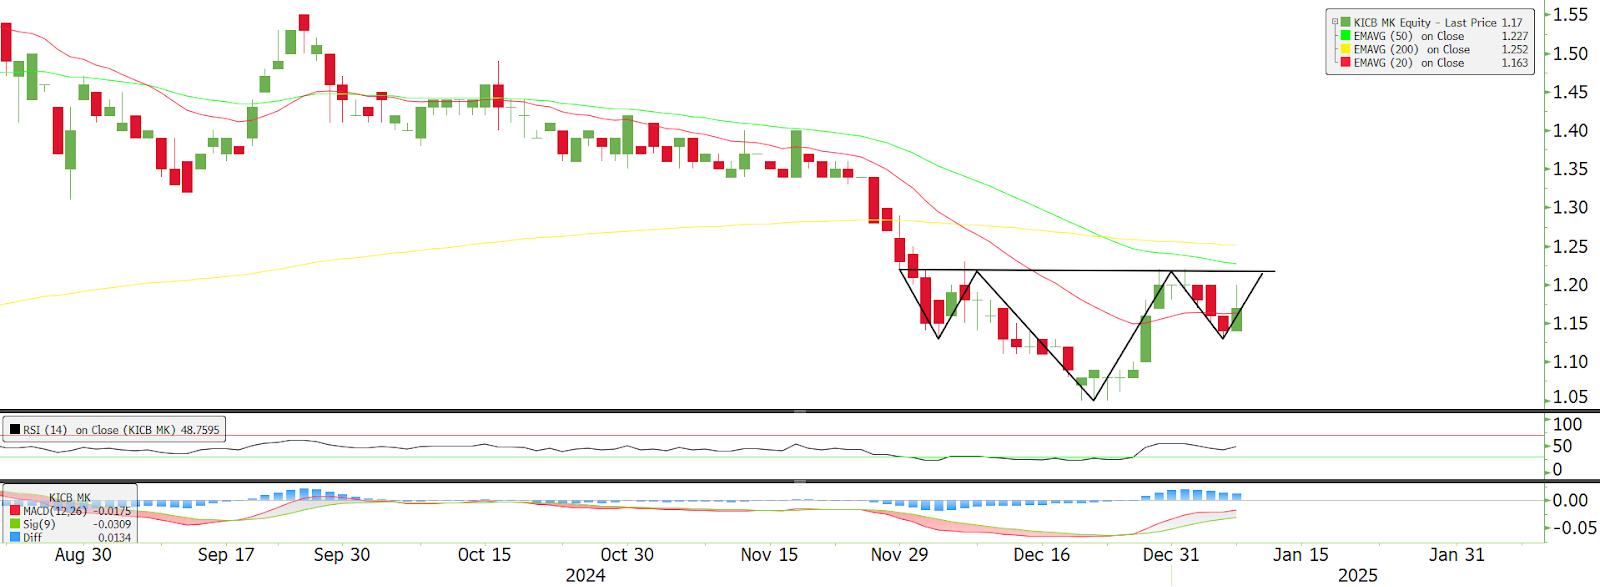
Kimlun (5171) - All Eyes on the Right Shoulder
MercurySec
Publish date: Thu, 09 Jan 2025, 08:33 AM

Technical Highlights
The stock reached its peak in August 2024 before entering a prolonged downtrend, hitting a new 52-week low of RM1.05 in December. Throughout this period, the stock has formed a head-and-shoulders pattern, with the right shoulder still in the process of completion. If buying momentum continues to build this two week, we anticipate a breakout above the neckline, confirming the pattern. Currently, the stock is trading above the 20-day EMA and if the upward momentum sustains, the stock could challenge both the 50-day and 200-day EMAs soon, as these levels are within close range.
Momentum indicators are also aligning positively. The RSI has climbed to 54, recovering from its previous downtrend and moving steadily upward. Meanwhile, the MACD also has started to turn upward since late December.
An ideal entry point for this stock would be between RM1.15 and RM1.18, with the first key resistance at the neckline of the head-and-shoulders pattern. Breaking through this resistance would pave the way toward the second resistance at RM1.33, a challenging level to surpass as it previously served as a key support zone during a consolidation phase. On the flip side, if the stock falls below RM1.13, it would indicate that the right shoulder has failed to form, invalidating the bullish reversal pattern.
Entry - RM1.15 - RM1.18
Stop Loss - RM1.12
Target Price - RM1.22 - RM1.33
Source: Mercury Securities Research - 9 Jan 2025
Related Stocks
| Chart | Stock Name | Last | Change | Volume |
|---|


