CIMB could trend higher
Nott_Invest
Publish date: Sun, 12 Sep 2021, 09:31 PM
CIMB
Sector: Banking
Analyzed on 12/09/2021


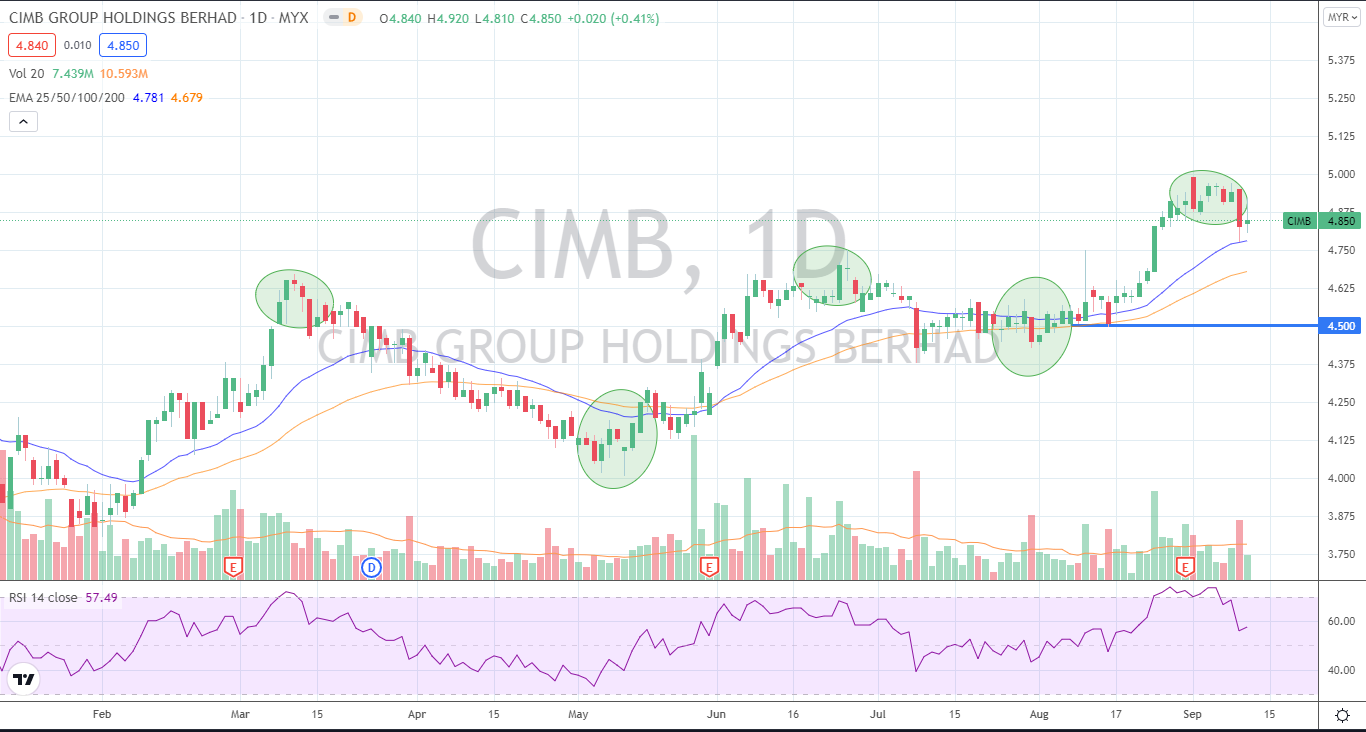
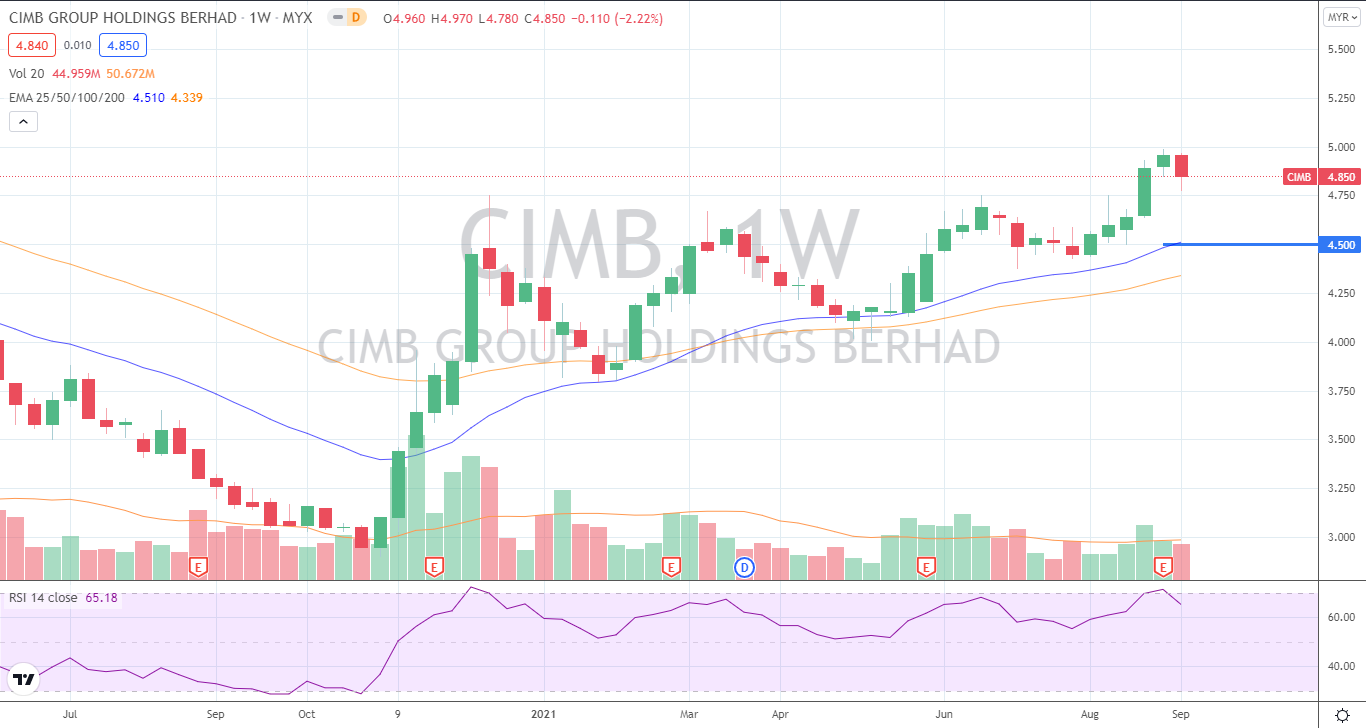
Attached are the weekly and daily charts of CIMB. CIMB reported a 291% Y-o-Y increased earnings in end of August, which boosted its share price from RM4.5 to a recent high of RM4.99. Its better earning is due to better-than-expected non-interest income (NoII) came from Treasury-related wealth management income. Chart wise, it’s quite obvious that the daily candlesticks are forming higher highs and higher lows. The EMA25/50 are also on a wave-like upward pattern. Taking a step back to Weekly chart, CIMB rebounded since Q42020 which made its weekly EMA25/50 to reverse from the downside and a golden cross occurred in March 2021. In line with analysts’ positive outlook on the company, it is likely that CIMB to continue its wave-like uptrend, supported by short-term support level at RM4.50 (weekly EMA25).
--------------------------------------------------------
Follow our FB and telegram channel for more investing and trading analysis. Share it out to your friends and family!
TELEGRAM :https://t.me/nottinvest
FB PAGE :https://fb.com/NottInvest
--------------------------------------------------------
Cheers
NOTT INVEST
Disclaimer:
This content by NOTT INVEST, is in no way a solicitation or offer to buy or sell securities or investment advisory services.
Readers should always seek the advice of an appropriately qualified professional and perform due diligence before making any investment decisions.
We shall not be liable for any errors or inaccuracies, regardless of cause.
Related Stocks
| Chart | Stock Name | Last | Change | Volume |
|---|
Market Buzz
2024-12-23
CIMB2024-12-23
CIMB2024-12-23
CIMB2024-12-20
CIMB2024-12-20
CIMB2024-12-19
CIMB2024-12-19
CIMB2024-12-19
CIMB2024-12-19
CIMB2024-12-18
CIMB2024-12-18
CIMB2024-12-18
CIMB2024-12-18
CIMB2024-12-17
CIMB2024-12-17
CIMB2024-12-17
CIMB2024-12-16
CIMB2024-12-16
CIMB2024-12-13
CIMB2024-12-13
CIMB


